OpenTelemetry-native observability—without the enterprise markup. Built-in cost control, drop filters, and budget alerts so you never get a surprise bill.
OpenTelemetry ingestion, ClickHouse storage, self-host or managed.
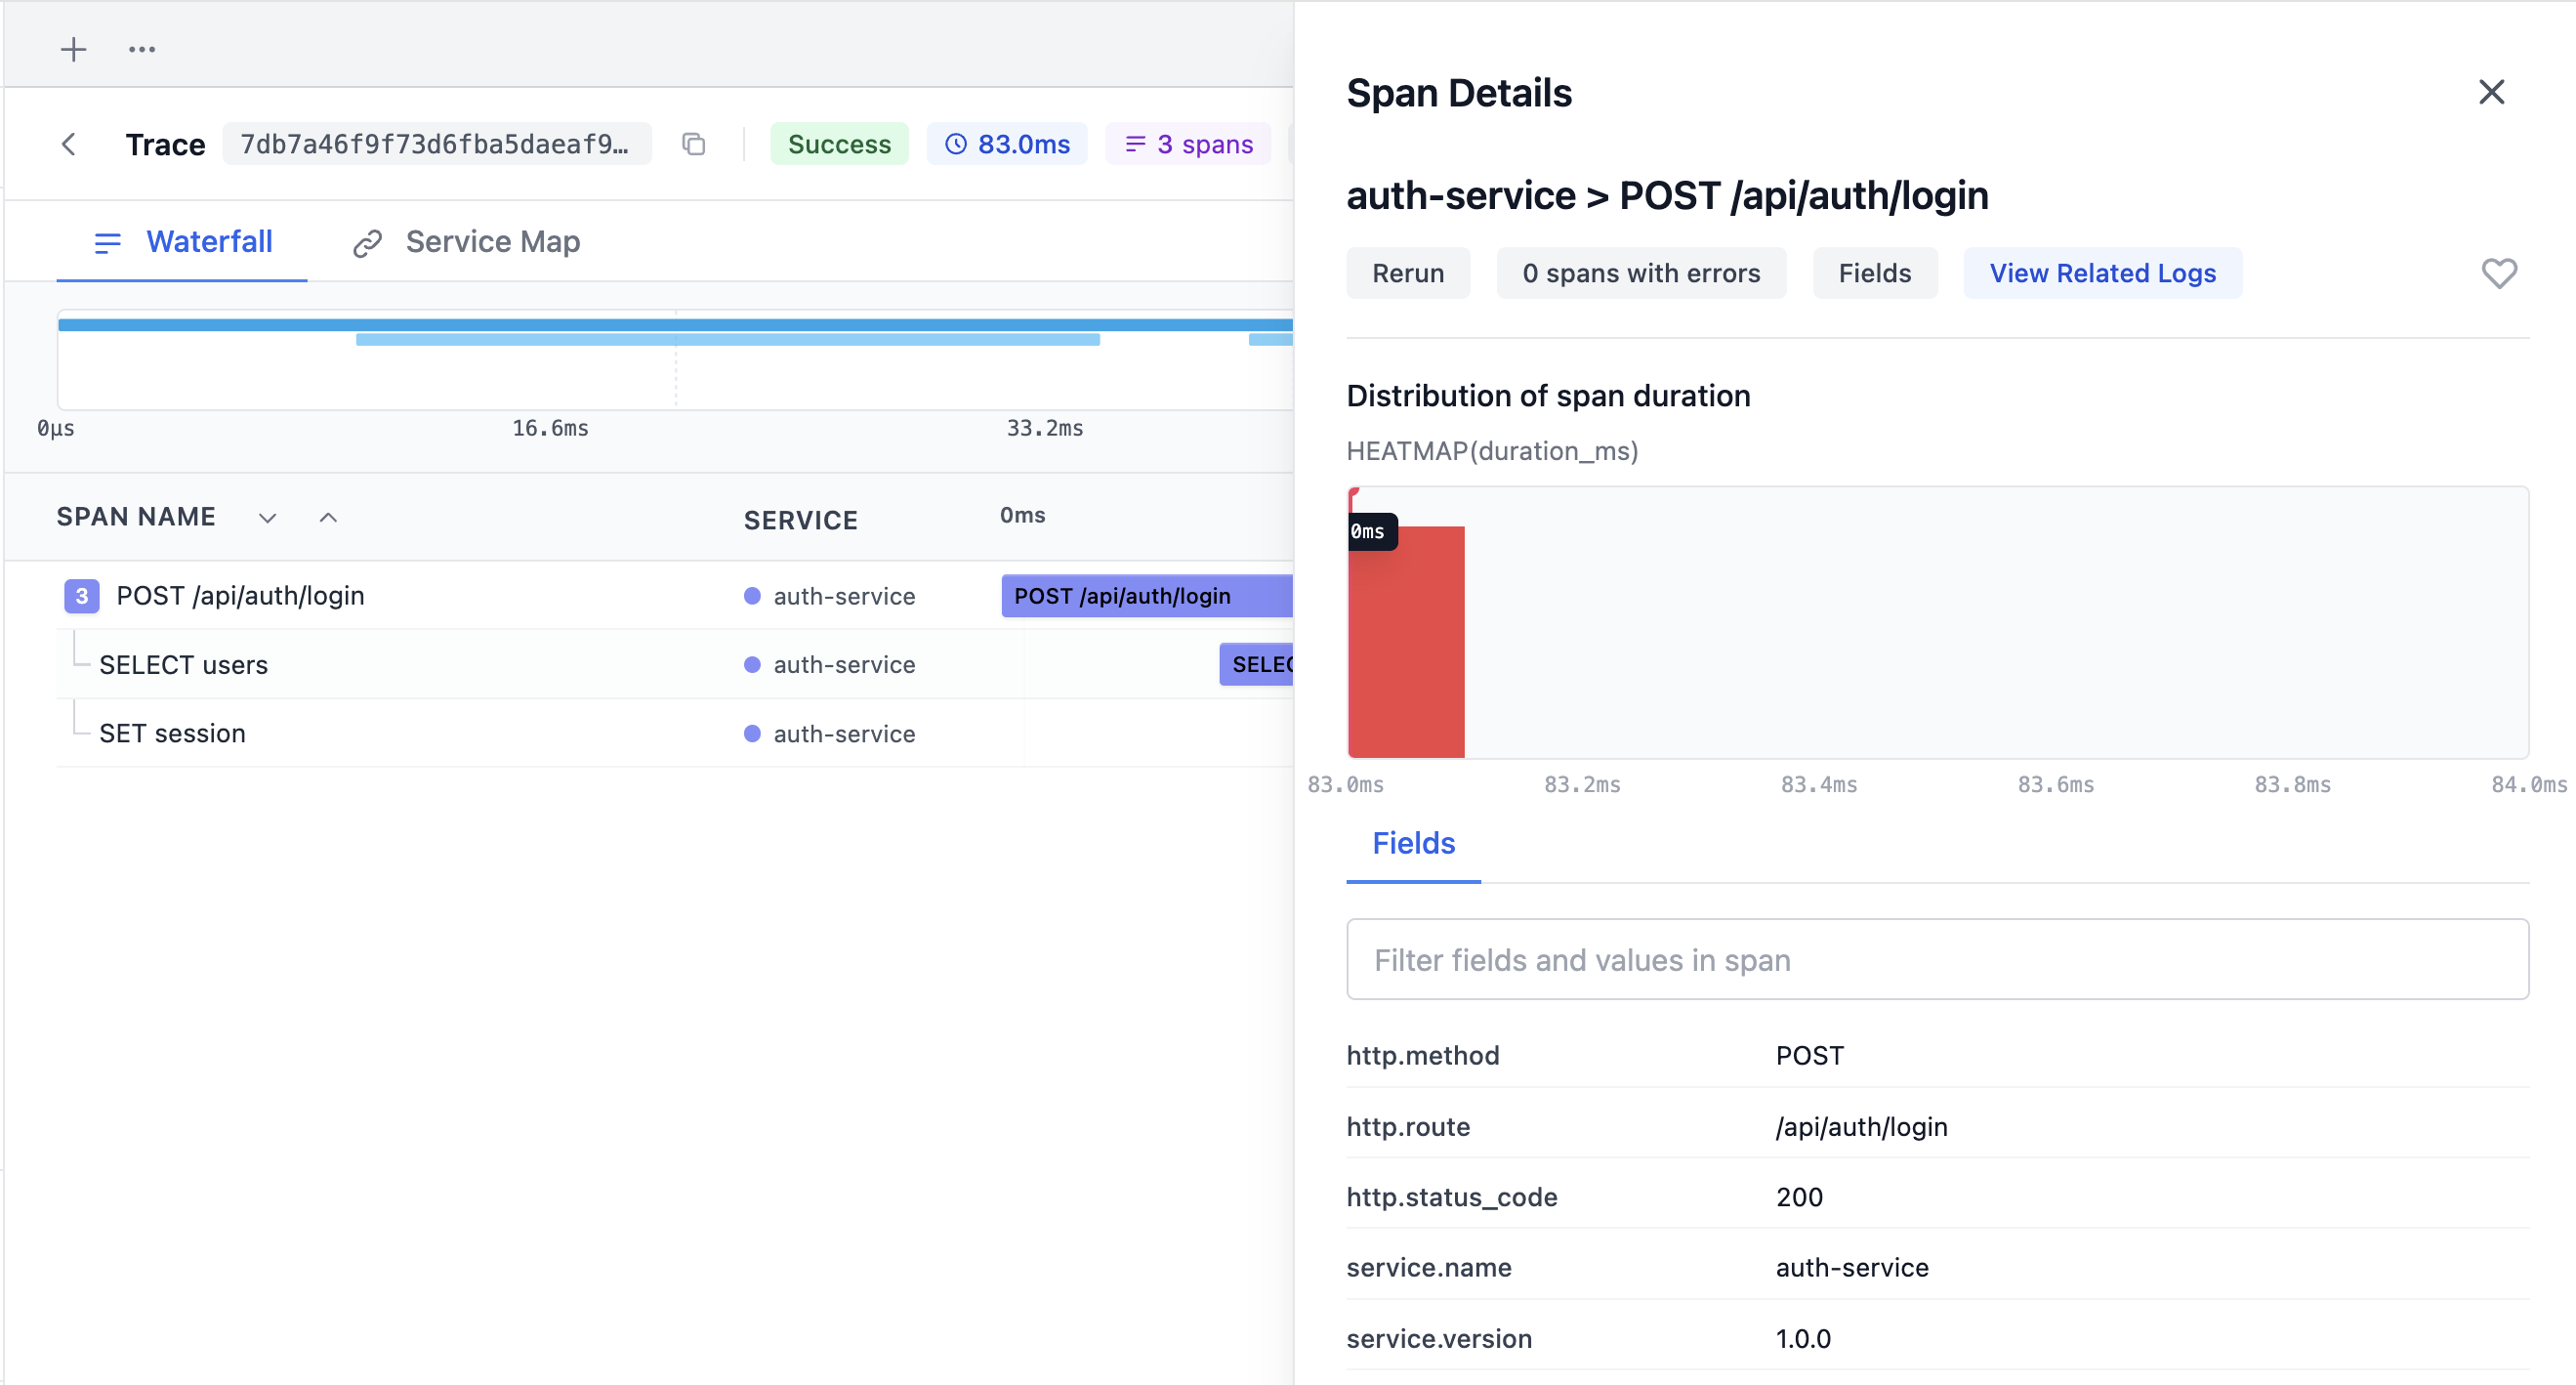
Distributed tracing with service maps and span analysis. OTLP-compatible.
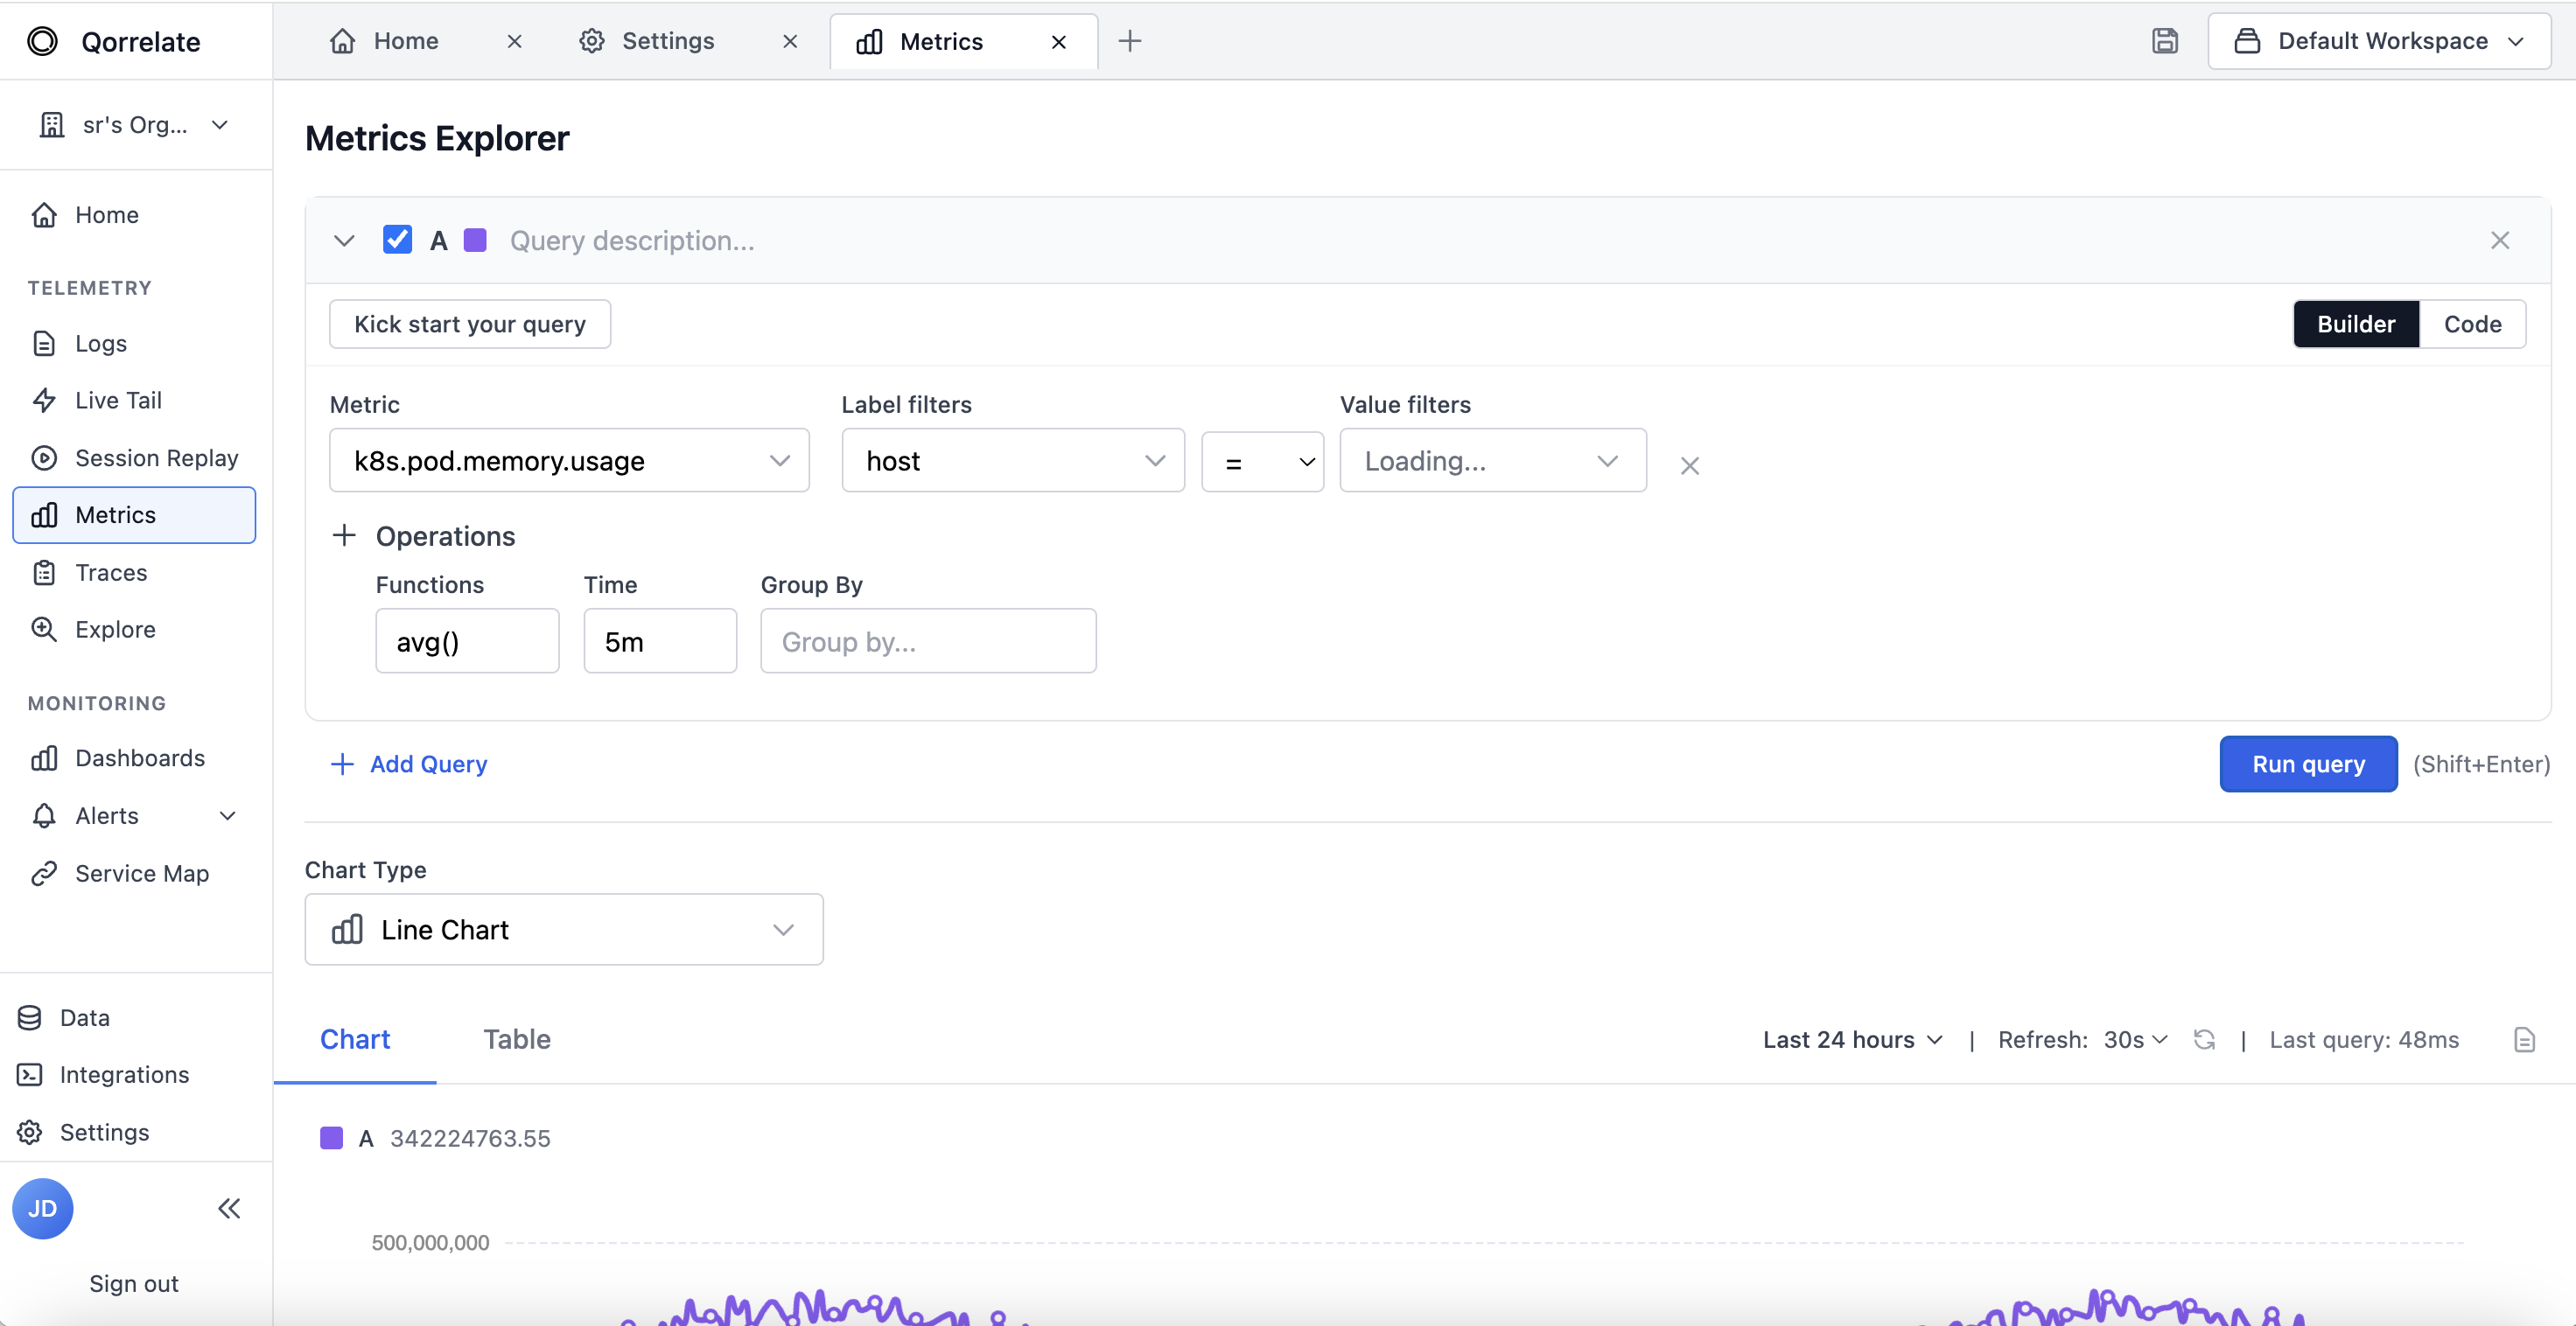
Query and visualize metrics stored in ClickHouse. Sub-second queries at scale.
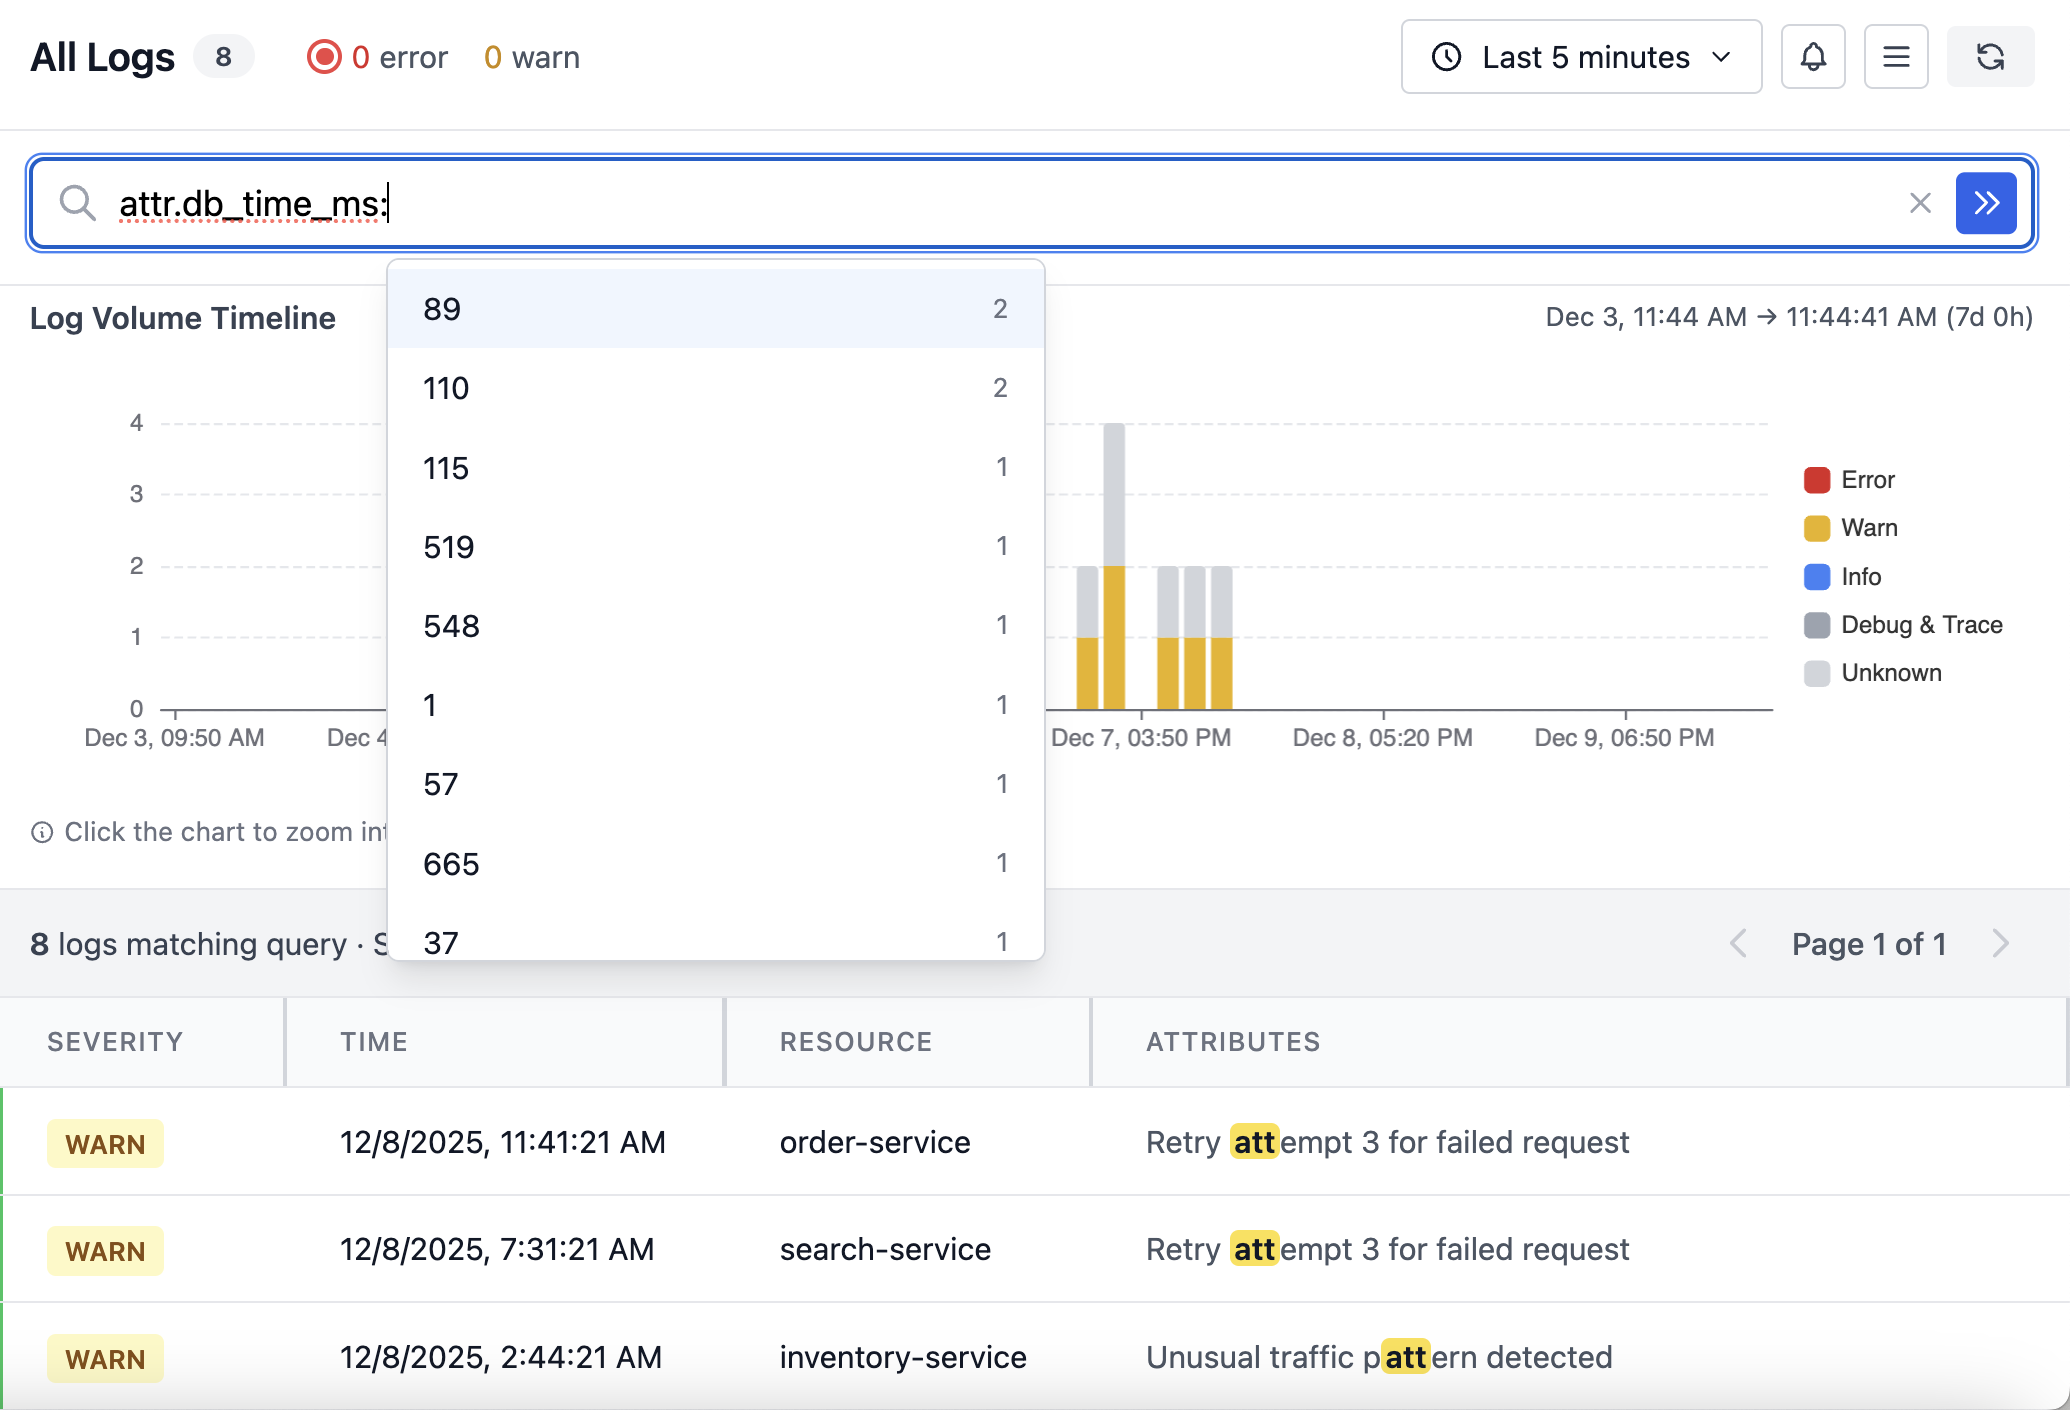
Full-text search across structured logs. Correlated with traces automatically.
Set quotas, drop filters, and budget alerts. Know exactly what you're spending.
Watch user sessions with DOM recording. Linked to backend traces and errors.
Your AI agent investigates issues using MCP. 100+ tools for automated debugging.
Point your OTLP exporter at these endpoints. No proprietary agents required.
Use these with your API key:
exporters:
  otlphttp:
    endpoint: https://qorrelate.io
    headers:
      Authorization: Bearer YOUR_API_KEY
Works with any language SDK: Python, Node.js, Java, Go, .NET, Ruby, Rust, PHP, and more
OpenTelemetry native — Works with any OTel SDK or collector. No proprietary agents, no vendor lock-in. Switch backends whenever you want. CNCF standard.
See how teams are saving on observability costs
"We cut our observability bill by 75% after switching from Datadog. The drop filters alone save us $2,000/month on noisy health check logs."
"The AI investigation tool is a game-changer. It found the root cause of our production incident in 2 minutes. Would have taken us hours to dig through logs manually."
"Budget alerts saved us from a $5k overage. Got notified at 80% usage, set up drop filters for DEBUG logs, and stayed under budget. Simple as that."
Send us your OpenTelemetry data. We'll store it in ClickHouse for a fraction of what you're paying now.
Our team is here to help! Send us your question and we'll get back to you as soon as possible.