Observability, Simplified
Qorrelate
Unified observability platform

Grafana
Fragmented multi-system observability
OpenTelemetry-native platform for seamless, standardized data collection and interoperability across cloud and distributed systems.
Your advantage: Standard OTel names mean portable dashboards, community runbooks, and zero rewriting when switching backends.
Grafana's LGTM stack uses different data formats across Loki, Mimir, and Tempo, making consistent semantic conventions harder.
Why it matters: Every renamed attribute means rewriting dashboards, alerts, and queries if you ever switch. OTel standards keep your data portable across any backend.
Logs, metrics, traces, and session replay in one unified platform. No multiple systems or manual data correlation.
Your advantage: No DIY assembly of Loki + Tempo + Mimir. Start observing immediately without integration work.
Requires assembling Loki, Mimir, and Tempo separately. Each tool needs its own deployment, config, and maintenance.
Why it matters: Assembling Loki + Tempo + Mimir means separate configs, scaling, and upgrades — time spent stitching instead of shipping.
Get started in minutes, not months. Fully managed with no infrastructure to maintain and no scaling to worry about.
Your advantage: Skip the Kubernetes and YAML. Your team focuses on building, not babysitting observability infrastructure.
Running the Grafana stack requires significant DevOps expertise for Kubernetes clusters, component config, and scaling.
Why it matters: DevOps time is expensive. Grafana's stack requires dedicated staff to keep Loki, Mimir, and Tempo running.
Click from a trace to logs, from logs to session replay. All signals are correlated via OpenTelemetry context.
Your advantage: Debug faster. Click from a trace to related logs or session replay without stitching systems together.
Correlating data across Loki, Mimir, and Tempo requires manual configuration. Context often gets lost between systems.
Why it matters: Incidents take longer to resolve when you're hopping between Loki, Mimir, and Tempo instead of one unified view.
See exactly what users experienced with built-in session replay, automatically correlated with backend traces and logs.
Your advantage: Understand user issues end-to-end. Replay ties frontend behavior to backend traces without a third-party add-on.
Grafana doesn't offer session replay. You need a separate tool like FullStory or LogRocket, adding another system to manage.
Why it matters: FullStory or LogRocket means another vendor, another integration, and another bill to reconcile.
Built on OpenTelemetry and Prometheus for flexibility, interoperability, and future-proof observability -- no vendor lock-in.

Your advantage: OTel and Prometheus are industry standards. No proprietary lock-in, no surprise migrations if you switch.
LGTM stack requires managing multiple projects (Loki, Grafana, Tempo, Mimir), each with its own configuration and upgrade cycle.
Why it matters: Four separate projects mean four upgrade cycles and compatibility headaches. Grafana Cloud adds its own lock-in on top.
Only pay for the telemetry data you actually use, after filtering out noise with the built-in spam filter.
Your advantage: Drop noise before it's billed. Filter out health checks and debug logs so you only pay for data that matters.
You pay for all ingested data upfront, regardless of any filtering applied within Grafana Cloud after ingestion.
Why it matters: You pay for every log line ingested, including noise. Traffic spikes create billing surprises with no filter-before-bill option.
See how we compare on the features that matter
| Features | Grafana |
|
|---|---|---|
| Easy to set up and use | ||
| OpenTelemetry-native | ||
| Unified platform (no assembly required) | ||
| Built-in correlation across signals | ||
| Session replay | ||
| Fully managed (no ops burden) | ||
| AI-powered log analysis |
No complex setups, no maintenance – all the context for your logs, metrics and traces.
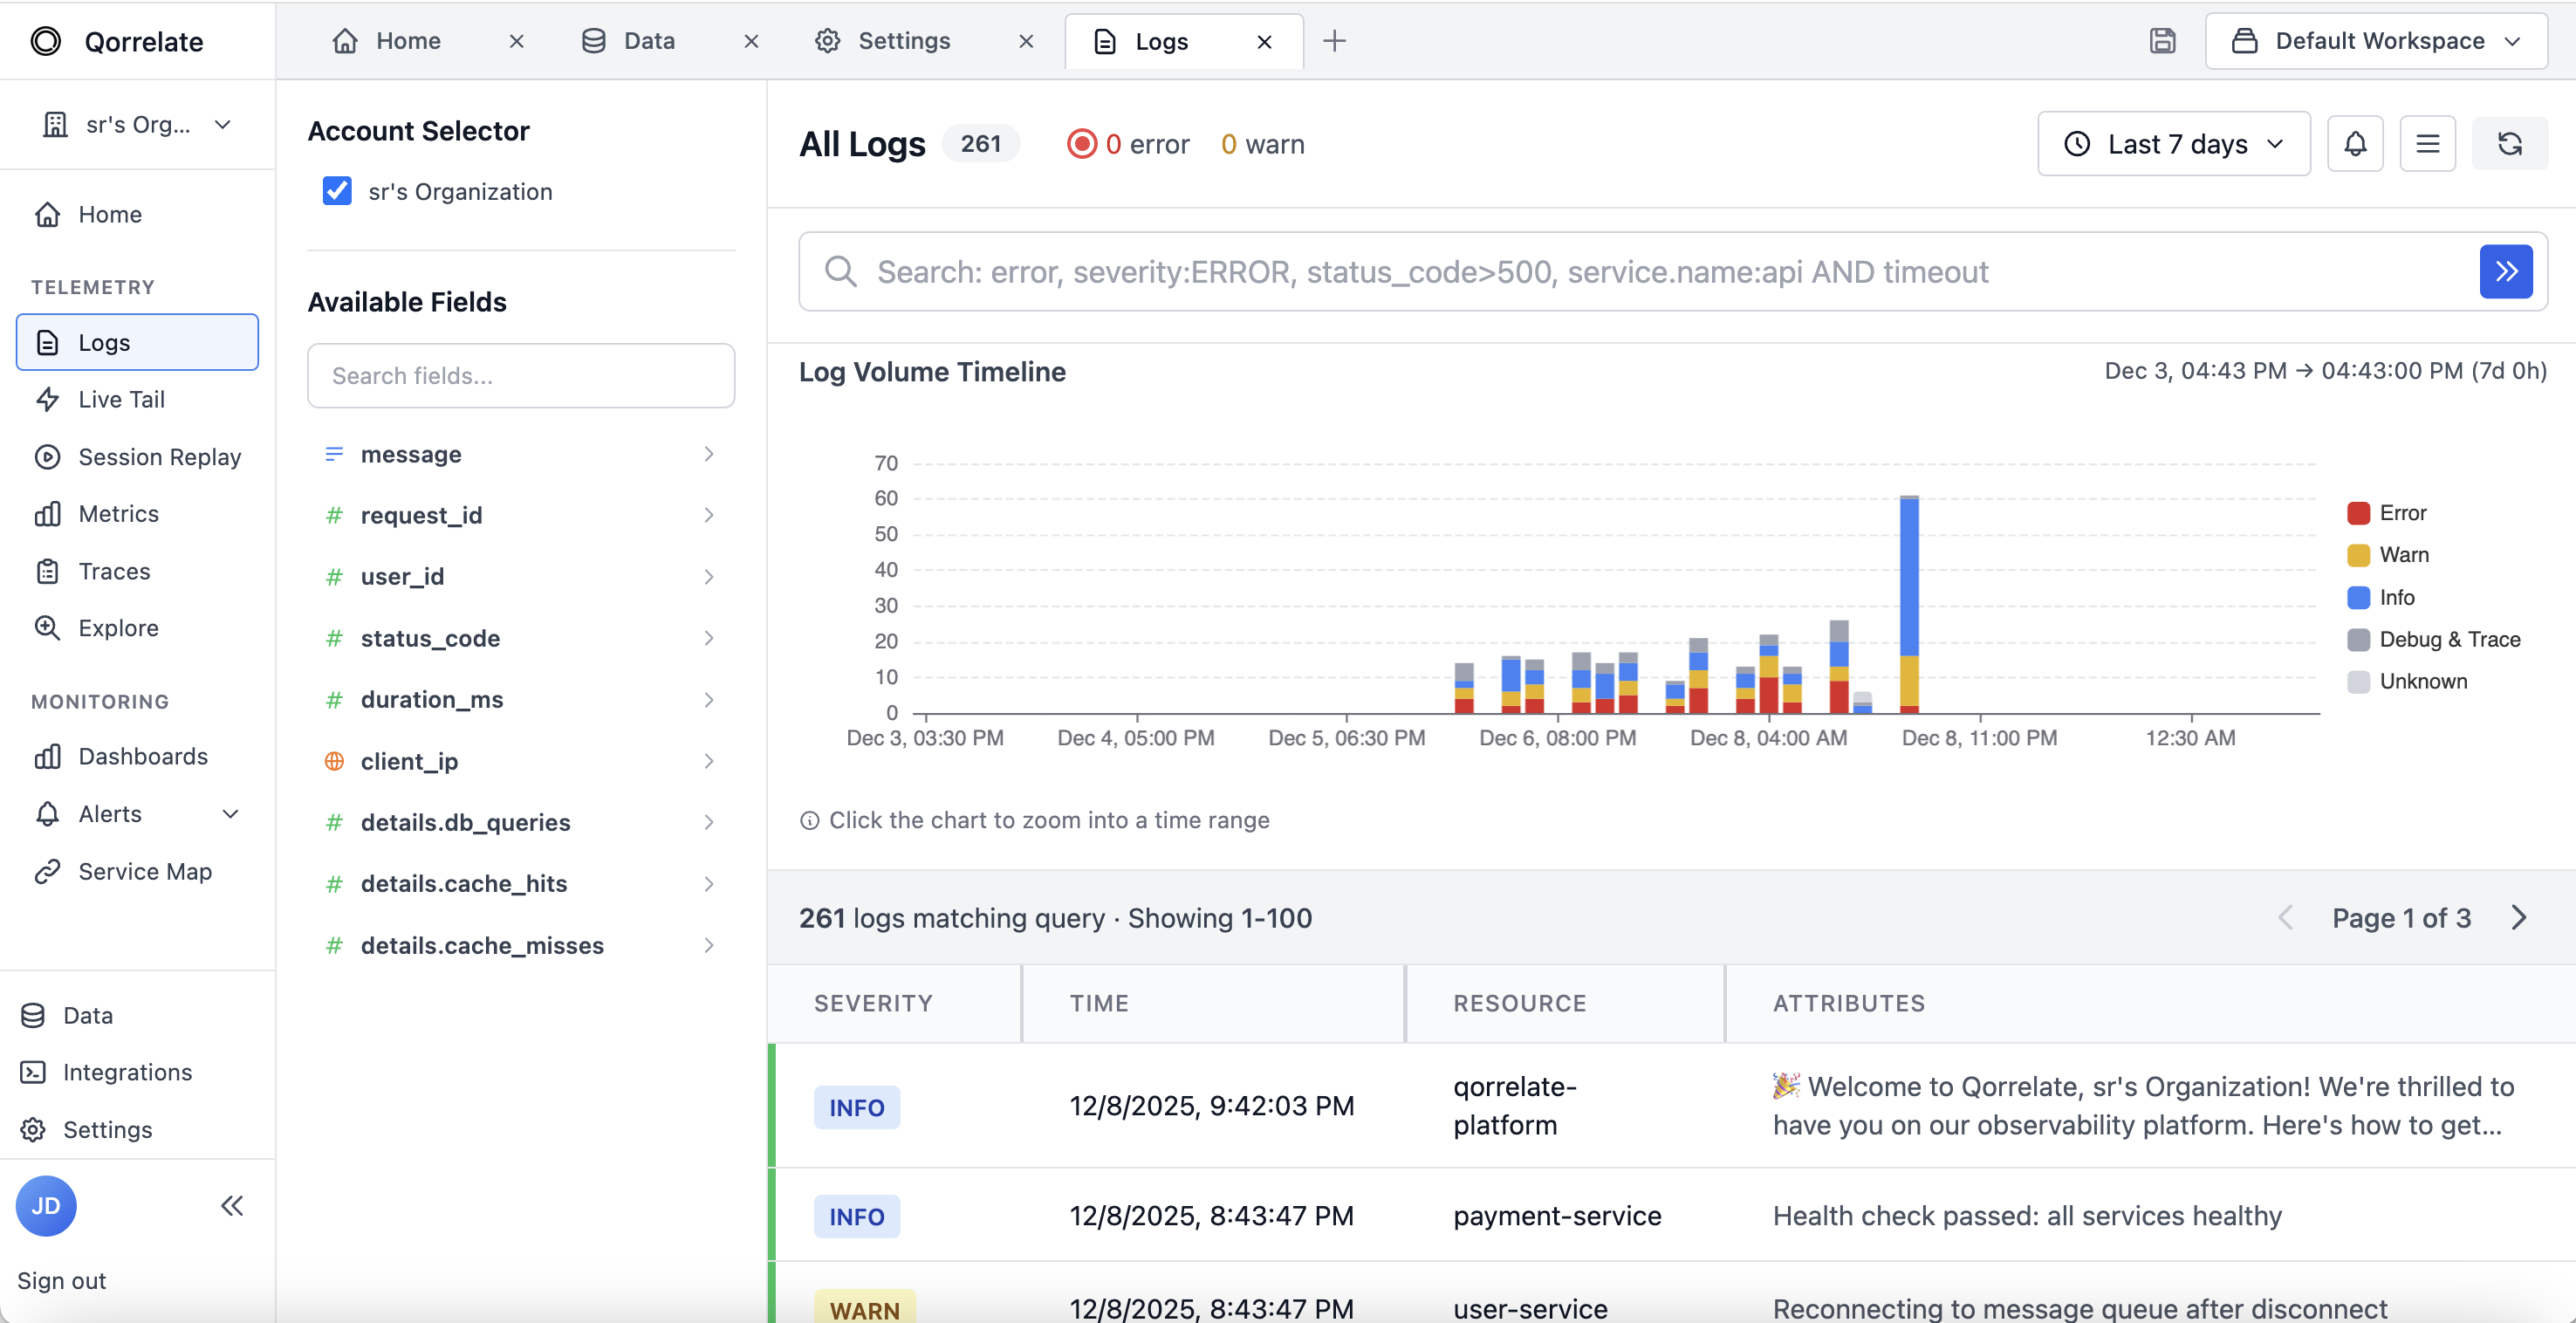
Manage diverse logs with the fastest search and filtering capabilities. Leverage OpenTelemetry semantic conventions for context.
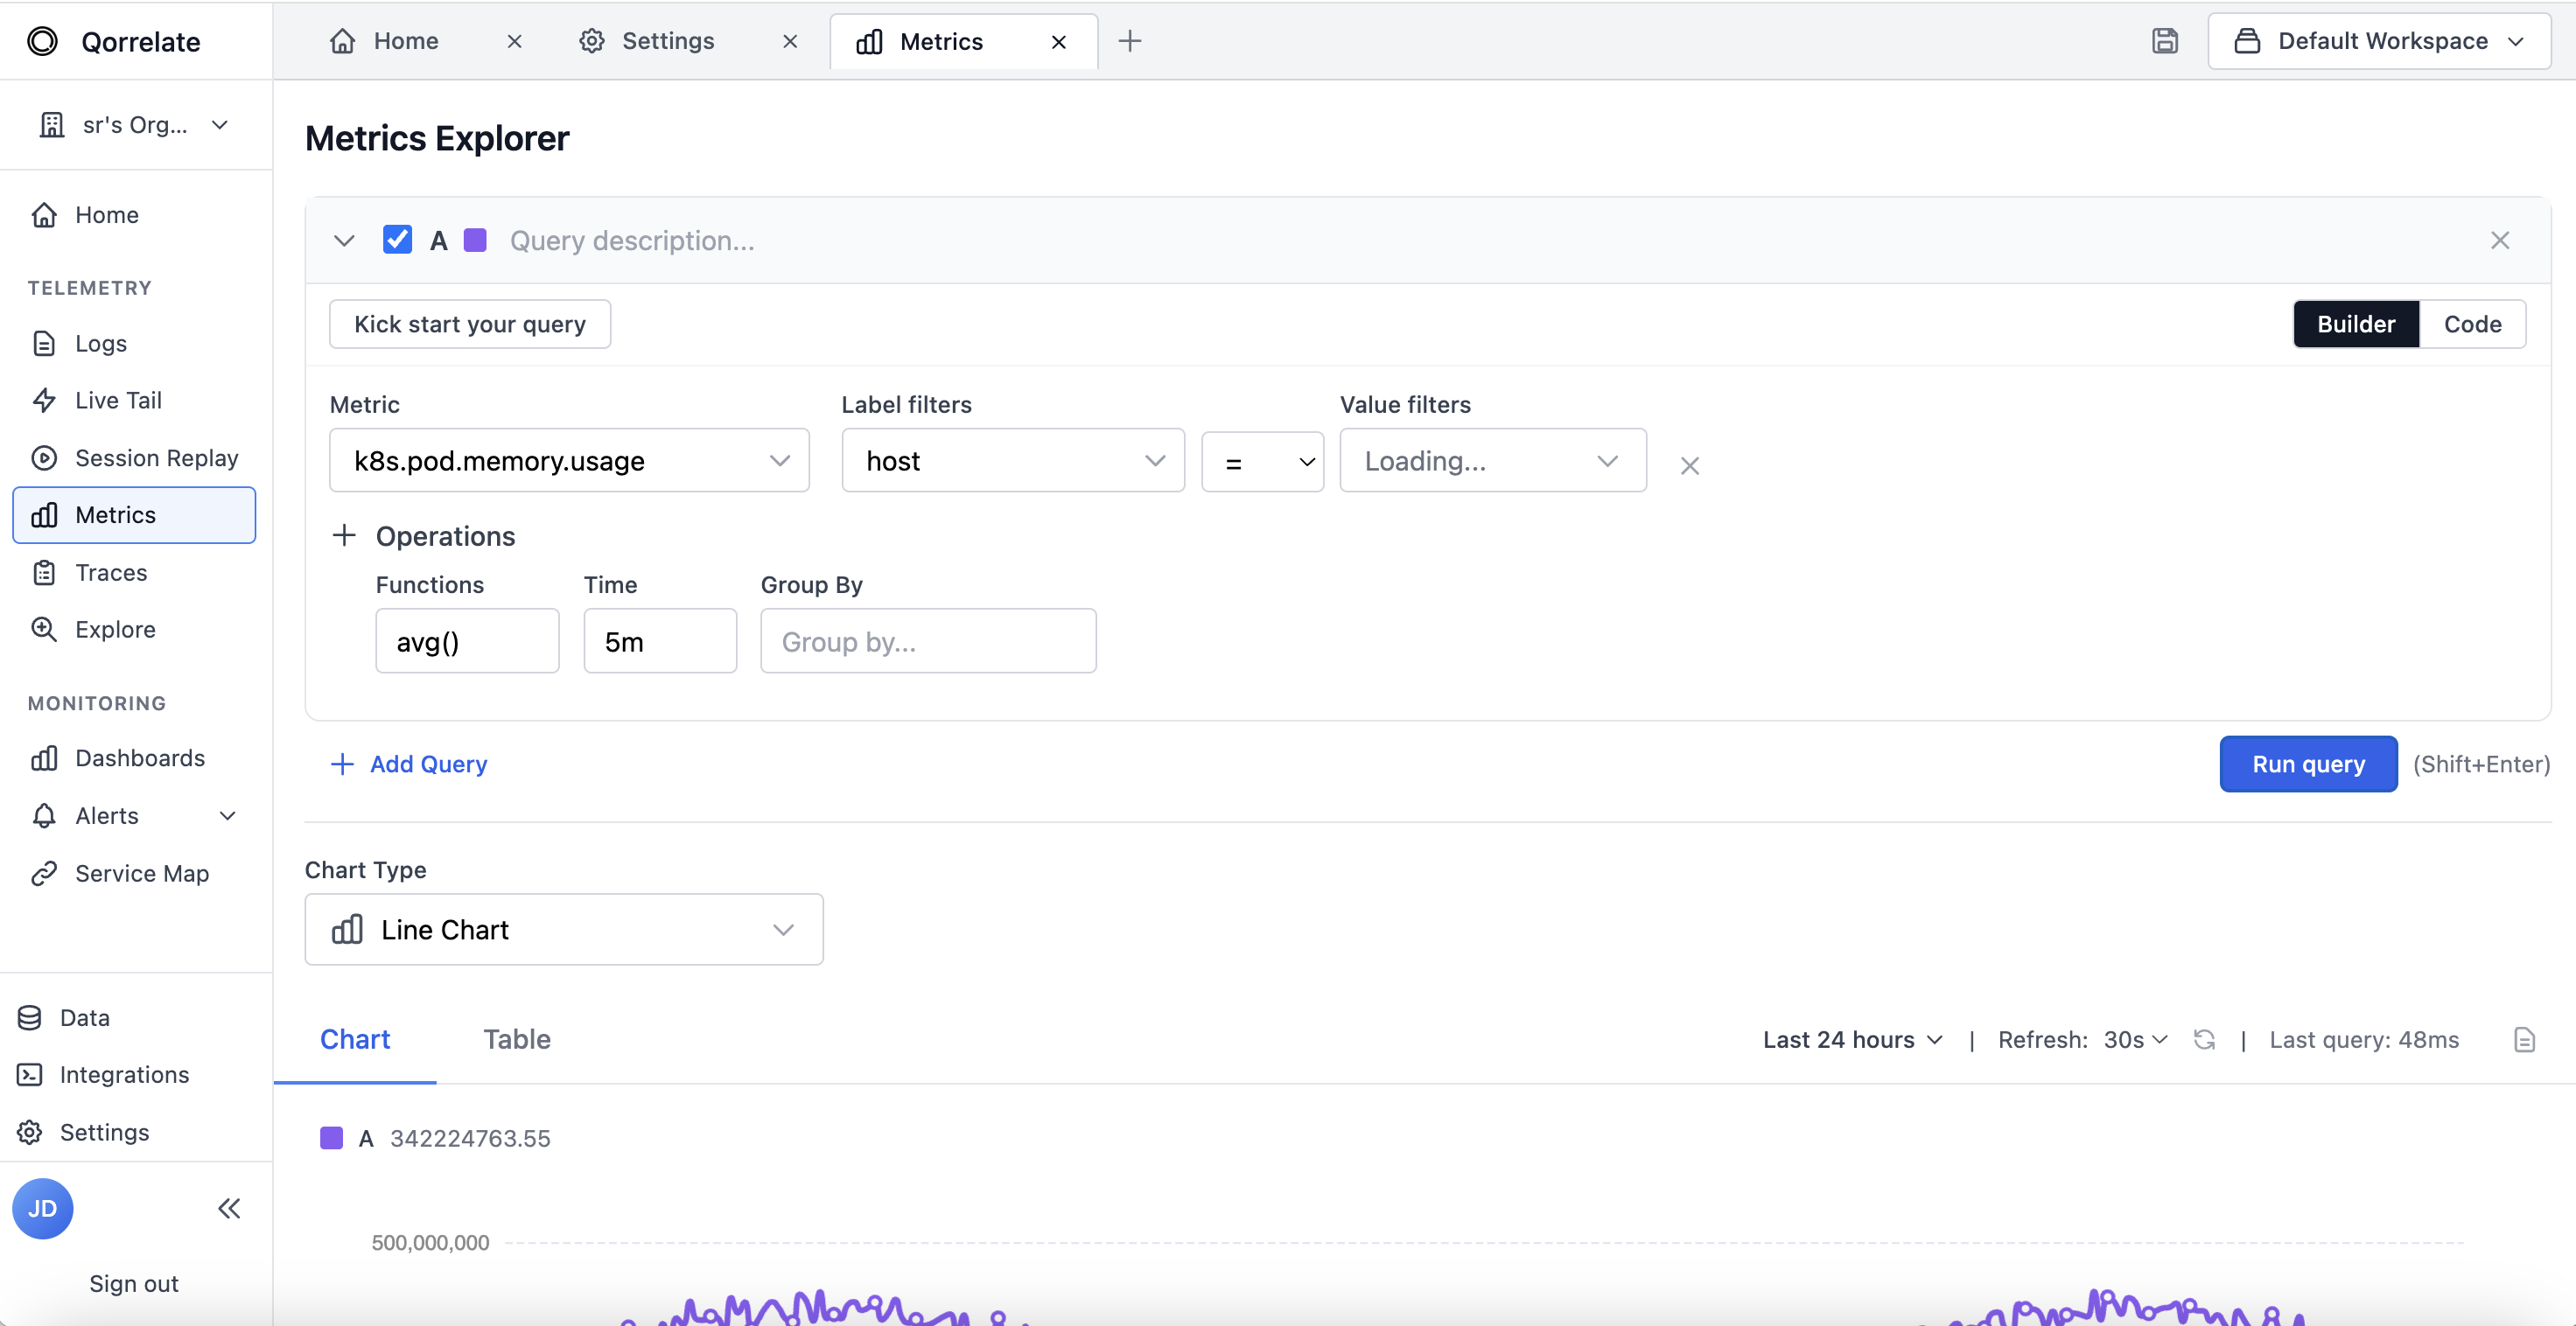
Centralize Prometheus & OpenTelemetry metrics to monitor your infrastructure and service with ease.
Spot errors and bottlenecks: real-time search and filtering capabilities for all high cardinal attributes.
Get started in minutes with OpenTelemetry-native monitoring