Observability, Simplified
Qorrelate
Predictable pricing

New Relic
Usage surprises
OpenTelemetry-native platform for seamless, standardized data collection and interoperability.
Your advantage: OTel-native means your instrumentation works with any backend. No vendor lock-in, no attribute rewriting.
New Relic accepts OTel data but renames attributes internally. Best features require their proprietary instrumentation.
Why it matters: Every renamed attribute means rewriting dashboards, alerts, and queries if you ever switch. OTel standards keep your data portable across any backend.
Simple per-GB pricing so you always know what you'll pay. One rate for logs, metrics, and traces. No surprises.
Your advantage: Simple per-GB pricing means you can forecast budgets. No per-user seat fees that scale with team size.
New Relic charges per user plus data ingest. Traffic spikes can lead to unexpected overages and budget surprises.
Why it matters: Per-user pricing plus usage means costs grow with both headcount and traffic. Traffic spikes can blow budgets.
Built on open standards. Use any OTel-compatible instrumentation and maintain data portability.
Your advantage: Full OTel support across logs, metrics, and traces. Use any instrumentation—no proprietary agents required.
New Relic supports OTel but pushes their own agents. Best features require their proprietary instrumentation.
Why it matters: New Relic pushes their own agents for best results. Mixed stacks mean inconsistent data and harder migration.
Run Qorrelate on your own infrastructure for data sovereignty and compliance requirements.
Your advantage: Deploy on-prem or in your cloud for data sovereignty. Ideal for regulated industries and air-gapped environments.
New Relic is cloud-only. Your observability data must live on their servers.
Why it matters: Cloud-only means your observability data lives on their servers. No option for compliance-sensitive or air-gapped deployments.
Only pay for the telemetry data you actually use, after filtering out noise with the built-in spam filter.
Your advantage: Filter noise before billing. Drop spam at the edge and only pay for telemetry that adds value.
You pay for all ingested data upfront, regardless of any filtering applied within New Relic after ingestion.
Why it matters: You're charged for everything that hits their ingest pipeline. Debug logs and health checks you'll never query still cost money.
See how we compare on the features that matter
| Features | New Relic |
|
|---|---|---|
| Easy to set up and use | ||
| OpenTelemetry-native | ||
| Transparent pricing | ||
| No vendor lock-in | ||
| Self-hosted option | ||
| Session replay | ||
| Telemetry spam filter |
No complex setups, no maintenance – all the context for your logs, metrics and traces.
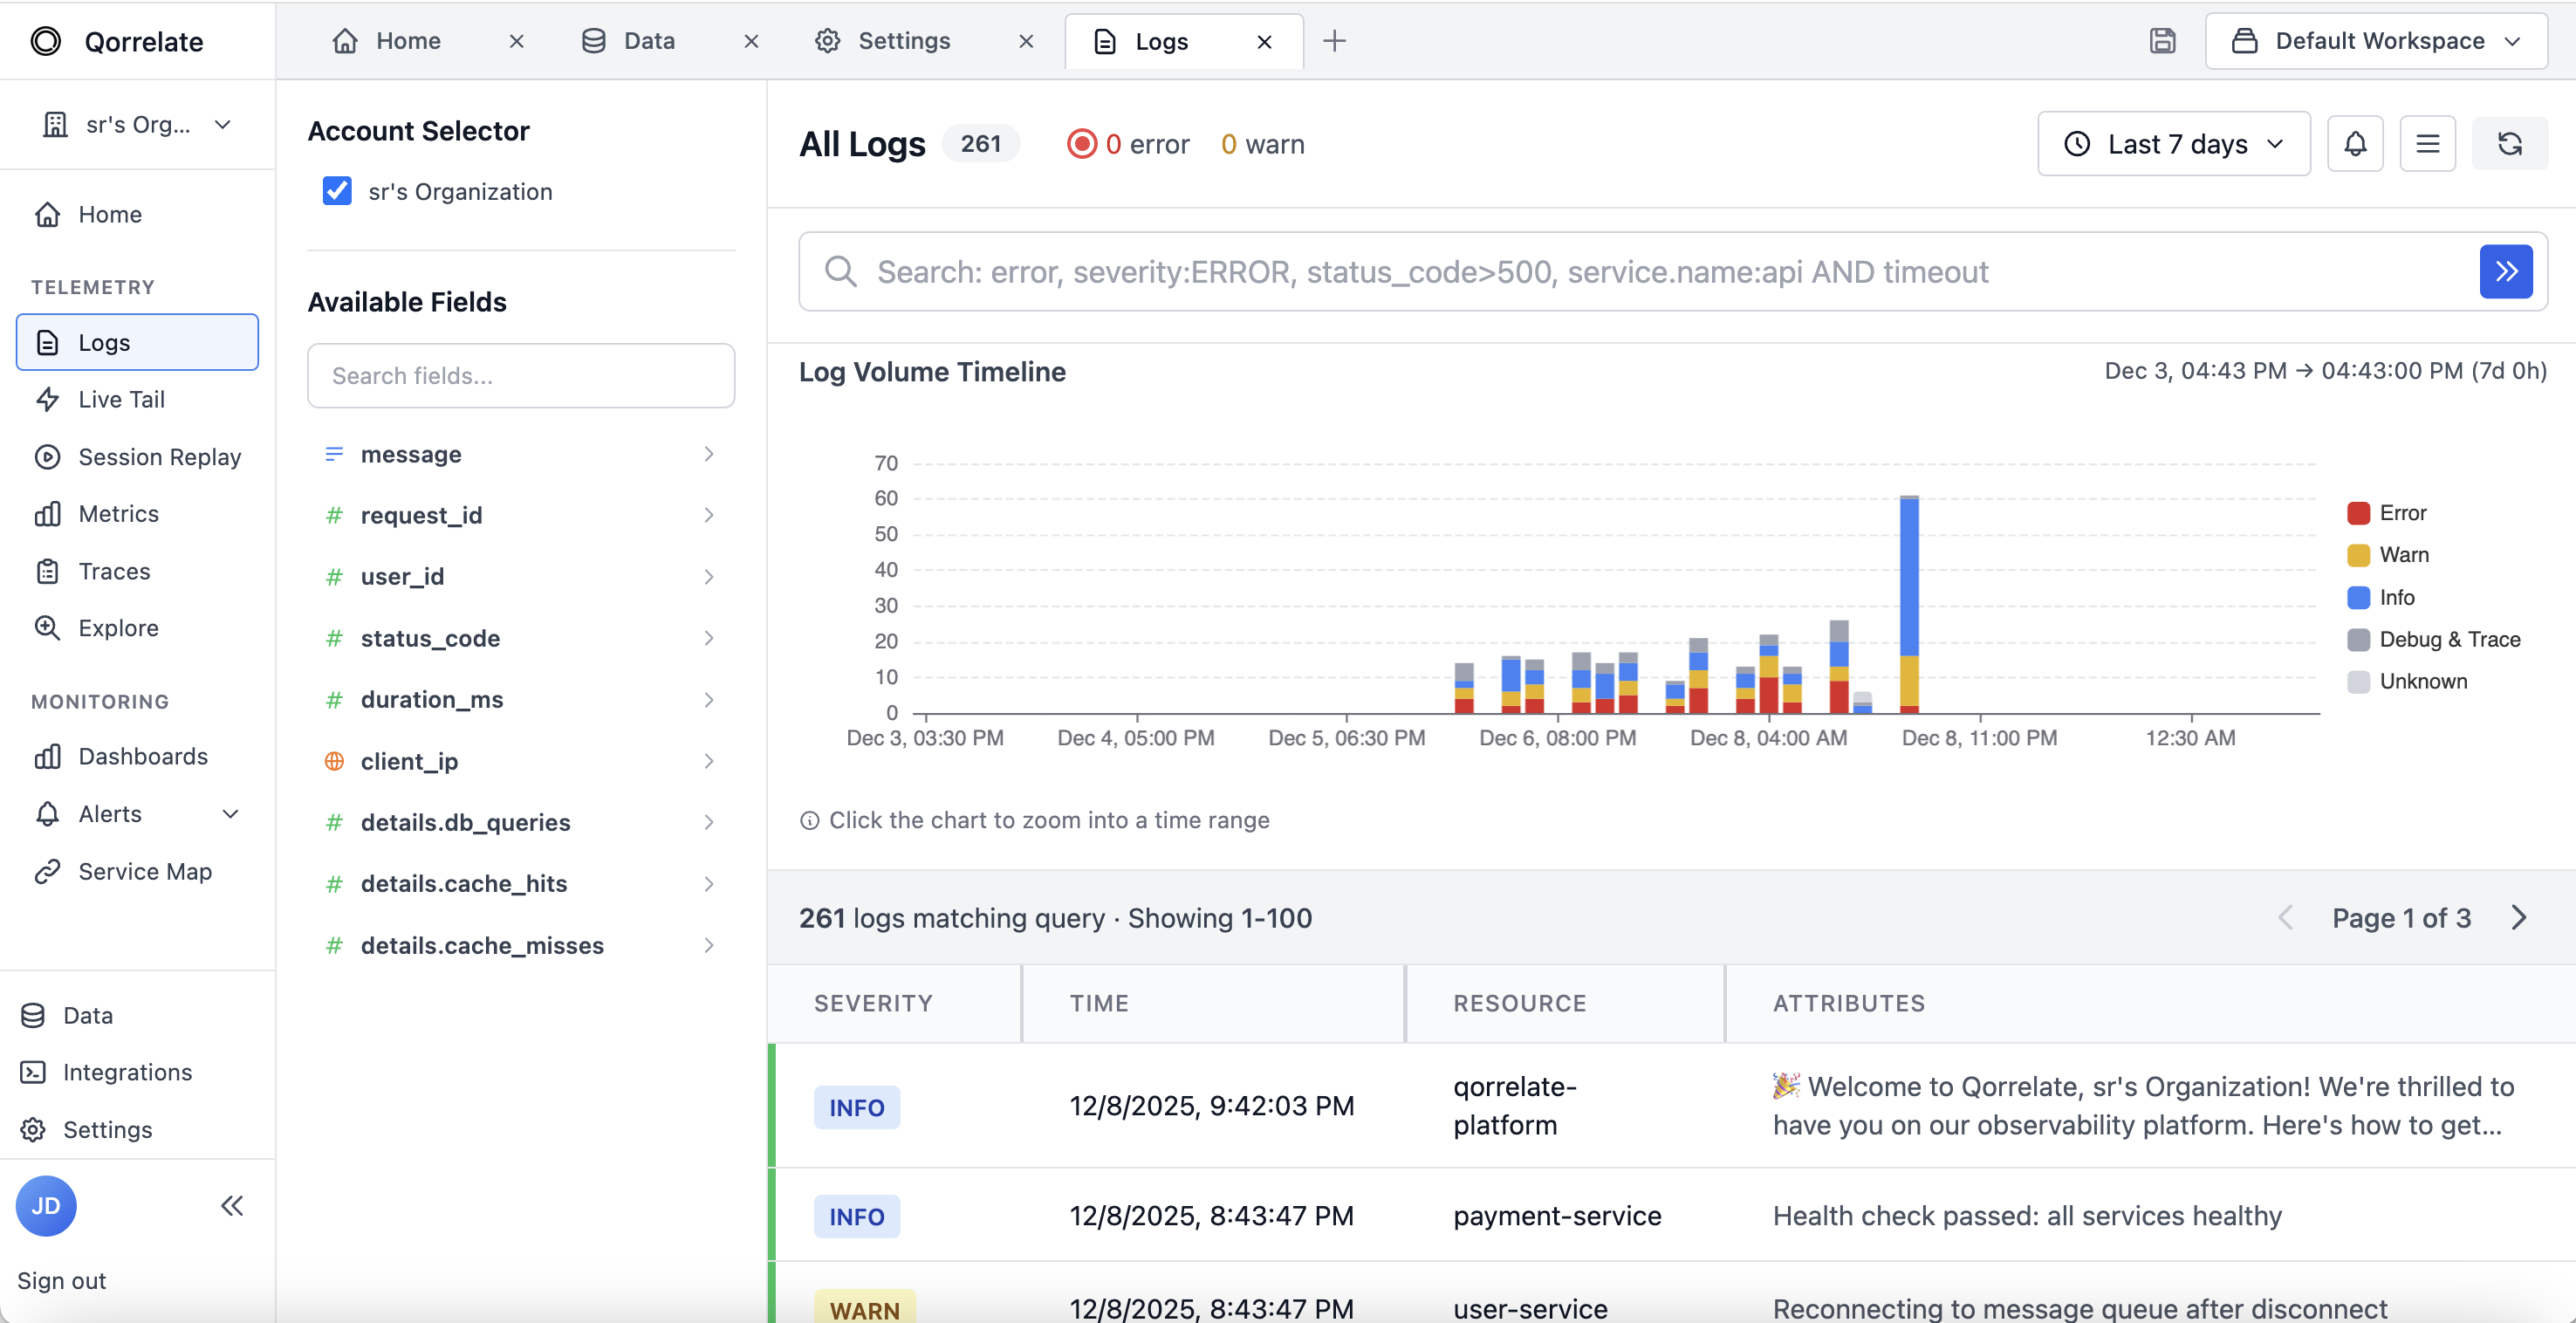
Manage diverse logs with the fastest search and filtering capabilities. Leverage OpenTelemetry semantic conventions for context.
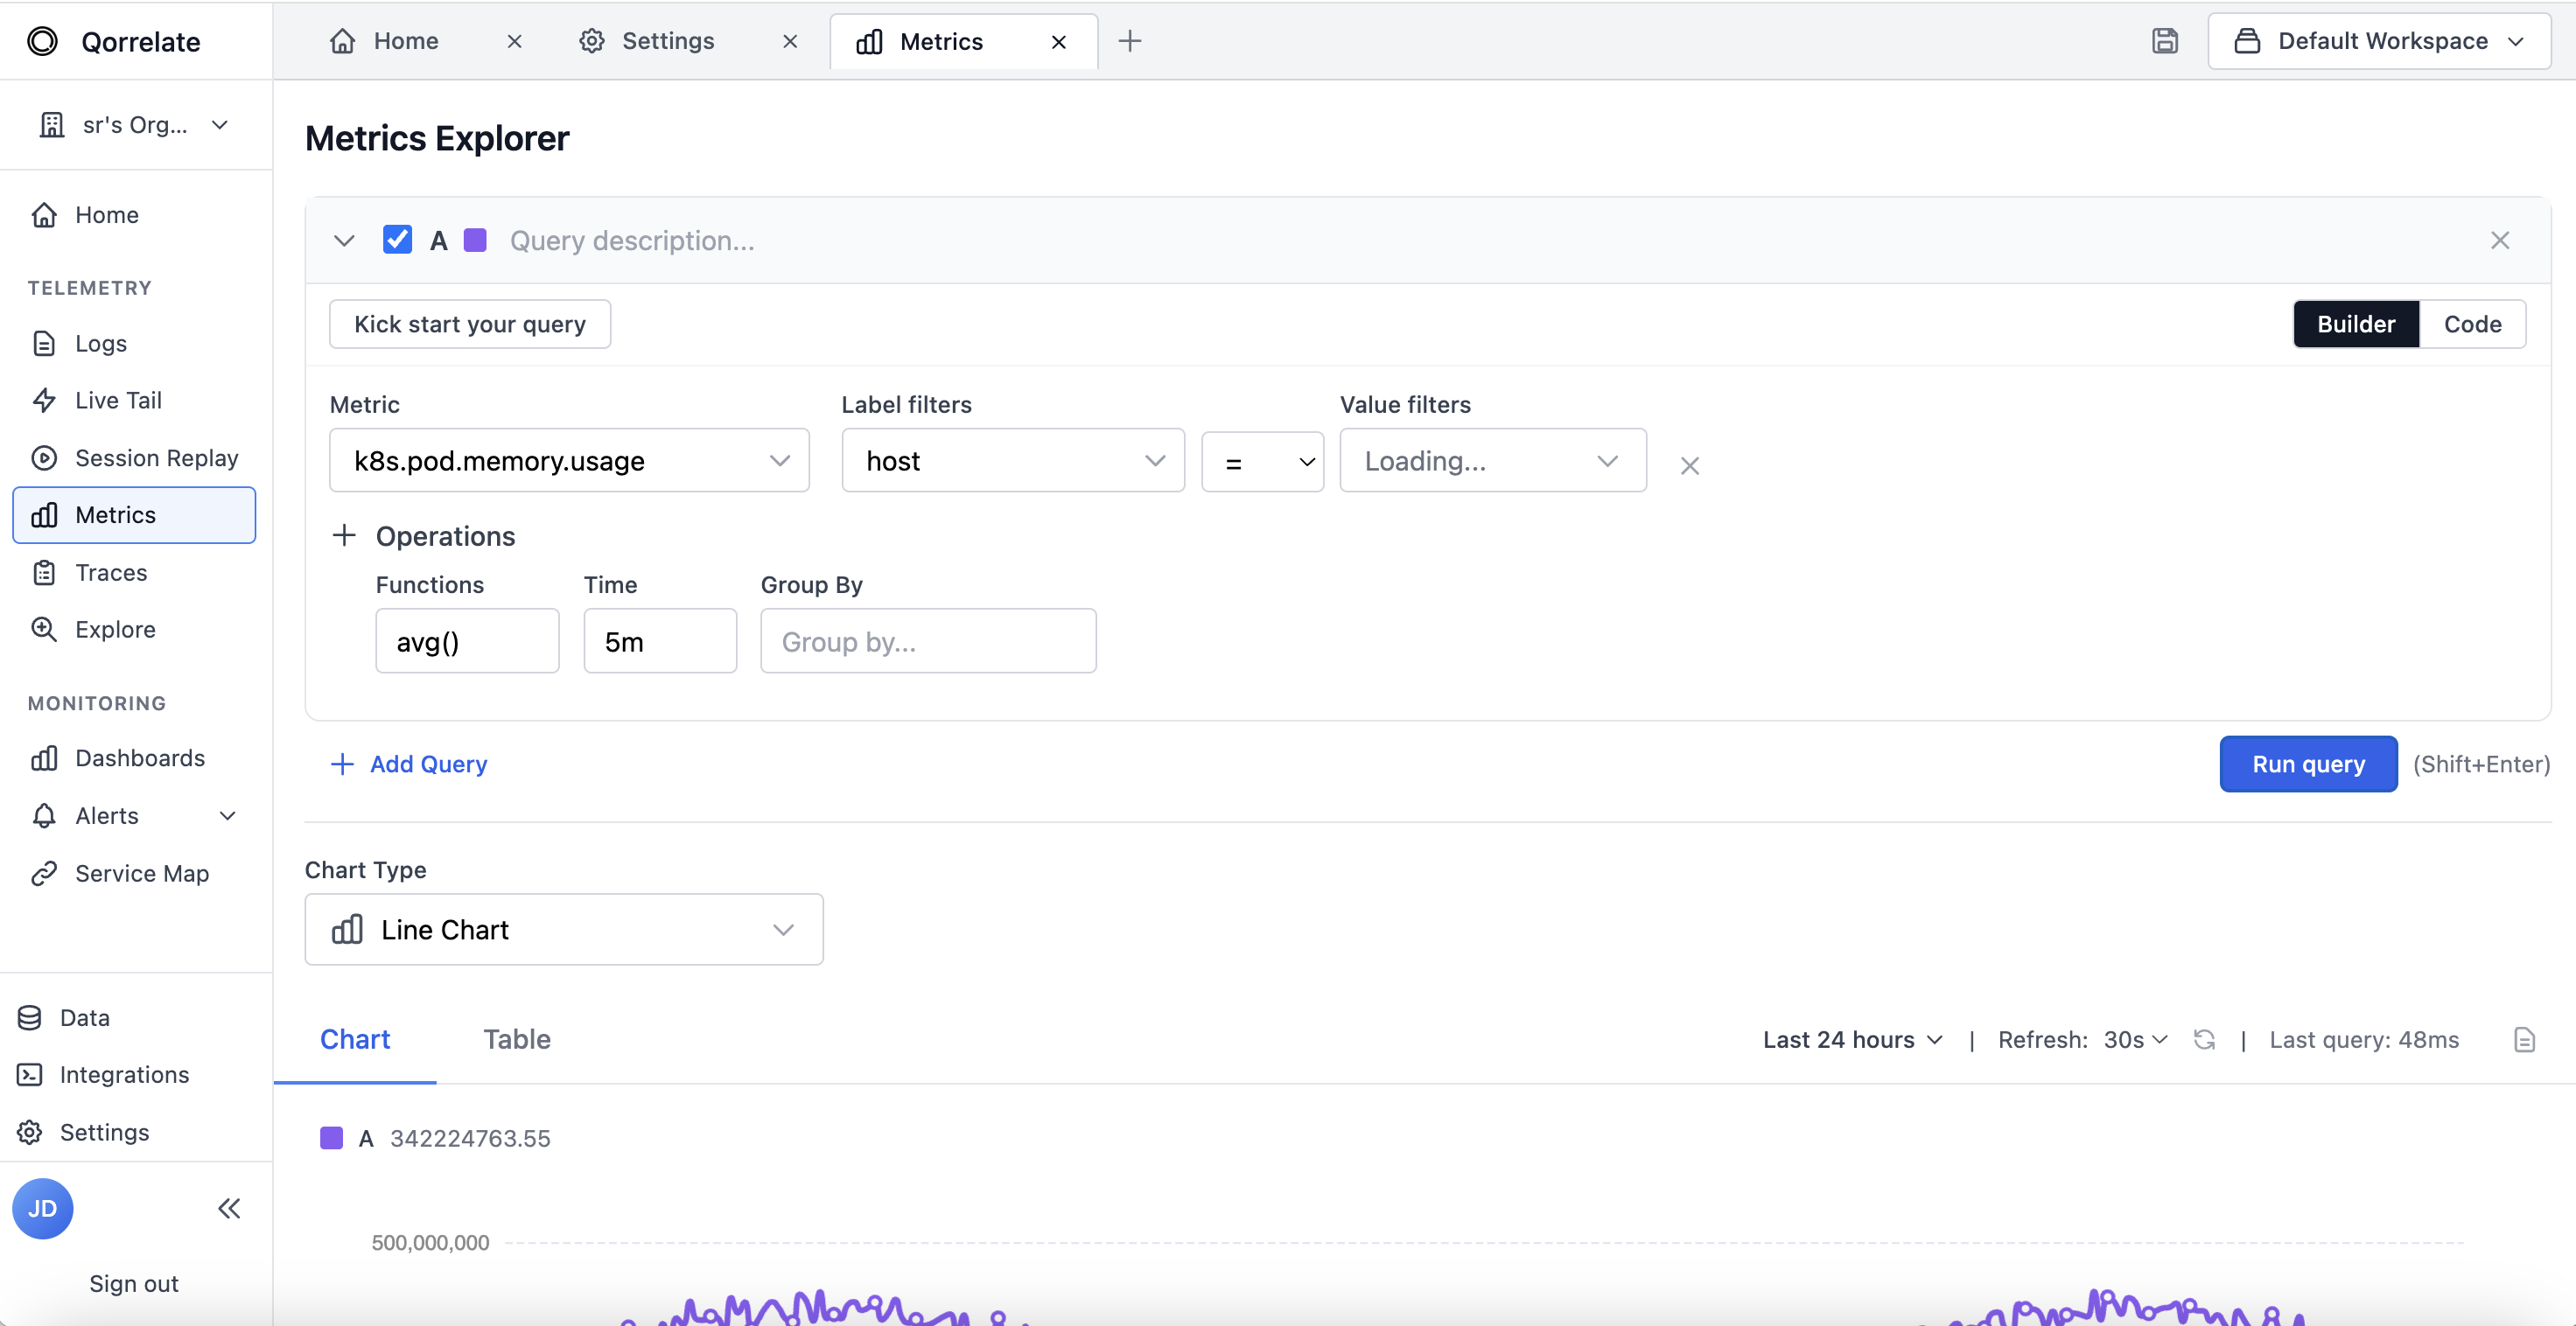
Centralize Prometheus & OpenTelemetry metrics to monitor your infrastructure and service with ease.
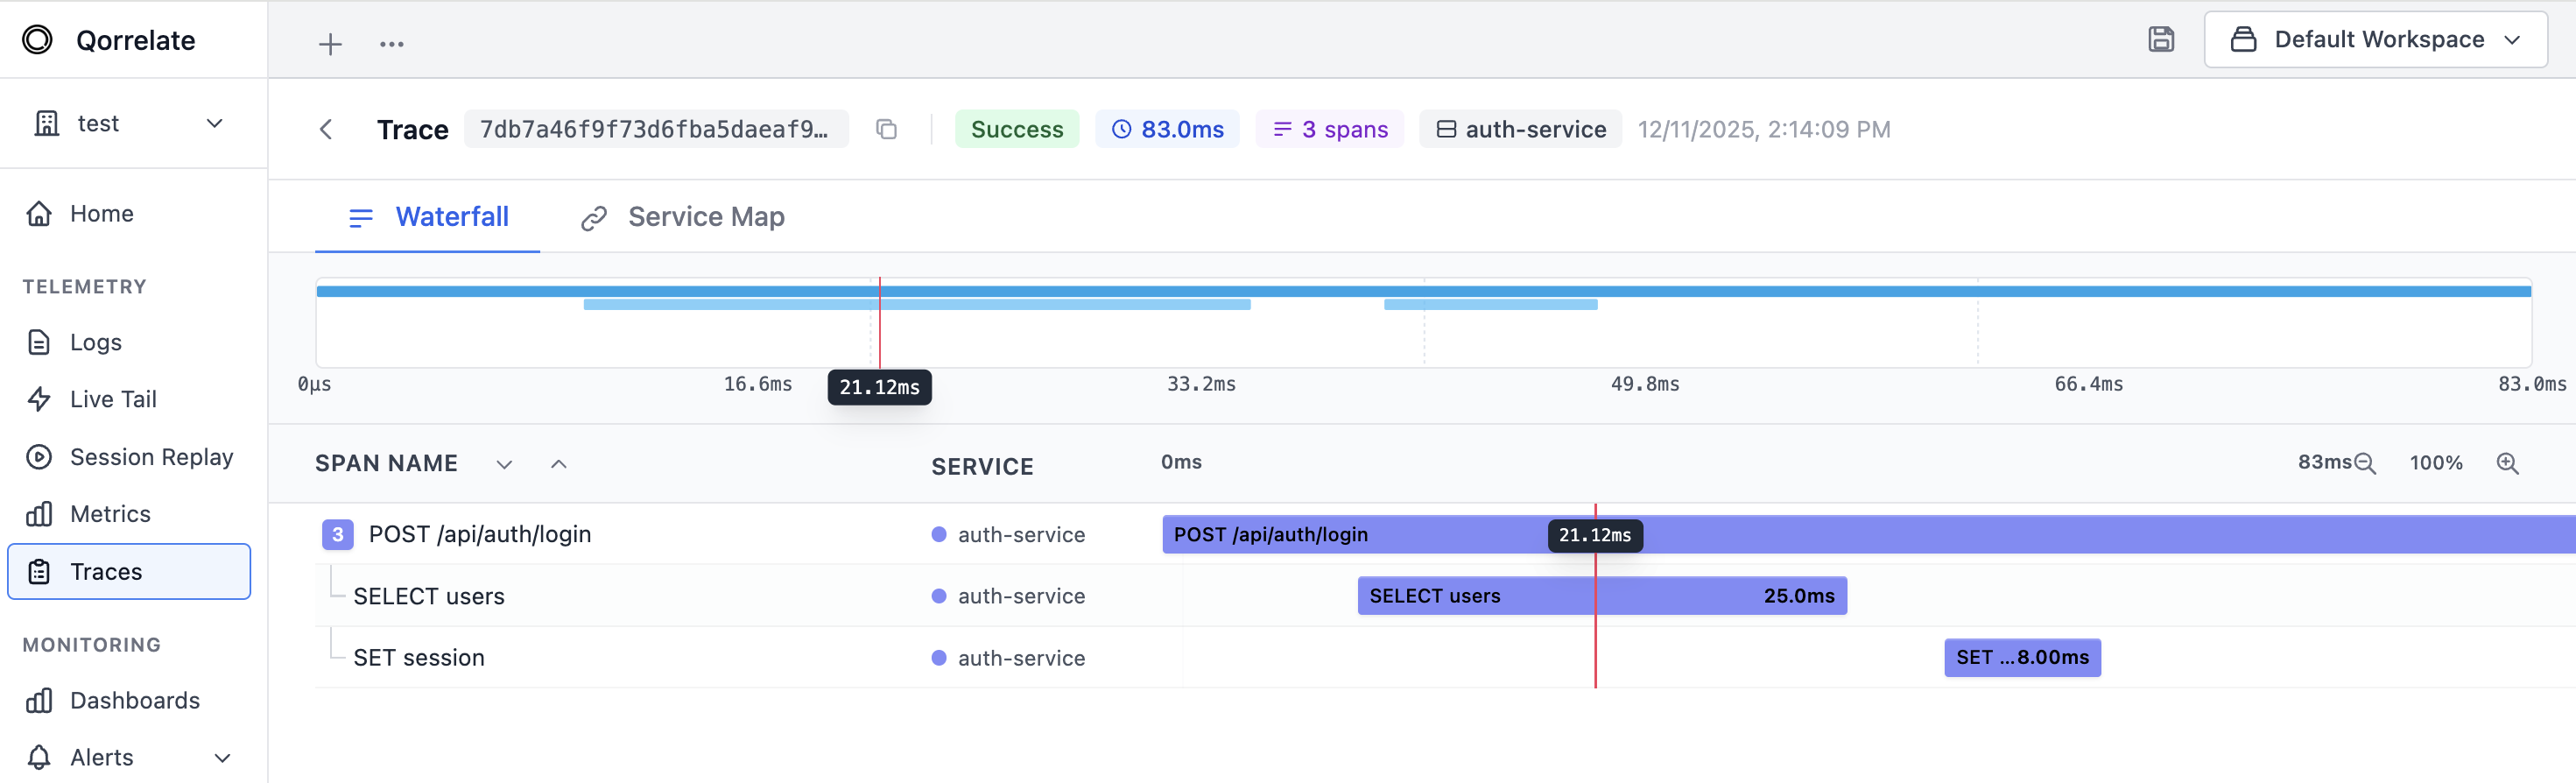
Spot errors and bottlenecks: real-time search and filtering capabilities for all high cardinal attributes.
Get started in minutes with OpenTelemetry-native monitoring