OTel-native, with session replay, self-hosting & AI built in
Qorrelate
Full-stack observability
Dash0
OTel-native observability
Watch exactly what users did before an error — DOM recording, click tracking, and rage-click detection, automatically correlated with backend traces.
Your advantage: Close the frontend-to-backend loop. See user actions, correlated errors, and the exact trace — without a separate FullStory subscription.
Dash0 covers backend observability well but has no session replay capability. Understanding frontend user behavior requires a separate tool.
Why it matters: Without replay, you can't connect frontend user actions to backend errors — forcing a separate tool purchase and broken context.
Deploy in your own infrastructure or use the fully managed cloud. Keep data within your VPC, meet any compliance requirement, and eliminate egress costs.
Your advantage: Strict data residency or air-gapped environments? Deploy Qorrelate entirely within your own infrastructure — no data leaves your control.
Dash0 is a fully managed SaaS platform. There is no self-hosted or BYOC deployment option, which limits use cases with strict data residency requirements.
Why it matters: For regulated industries (finance, healthcare, government), sending all telemetry to a third-party SaaS may be a blocker.
Ask questions in plain English, get answers from your live telemetry. The built-in MCP server lets AI agents query logs, traces, and metrics autonomously.
Why did checkout latency spike at 14:23?
Found: payment-svc p95 latency jumped from 120ms → 4.2s. Root cause: DB connection pool exhausted (23 blocked queries). First trace: a3f9b...
Your advantage: Qorrelate's MCP server lets AI coding assistants (Claude, Cursor) query your live observability data — turn incidents into automated investigations.
Dash0 offers standard query interfaces but no built-in AI assistant or MCP server integration for AI agent tooling.
Why it matters: As AI agents take on more engineering tasks, an observability platform without MCP support is a second-class citizen in the AI-first workflow.
Built-in pipeline controls let you drop noisy logs, sample high-volume traces, and aggregate metrics before they reach storage — so you pay only for signal, not noise.
Your advantage: UI-driven drop filters and sampling rules mean you reduce your bill in minutes — no need to reconfigure your OTel Collector pipeline.
Dash0 relies on configuring your OpenTelemetry Collector for data reduction. There are no in-platform drop filters or sampling controls.
Why it matters: Reducing your bill requires engineering work on collector config files, redeploys, and careful testing — not a quick UI toggle.
See how we compare on the features that matter
| Features | Dash0 |
|
|---|---|---|
| OpenTelemetry-native | ||
| Logs, metrics & traces | ||
| Perses dashboards | ||
| Transparent pricing | ||
| Session replay | ||
| Self-hosted deployment | ||
| AI chat & MCP server | ||
| Built-in drop filters & sampling | ||
| Cloud SIEM & security signals |
The full observability stack — no extra tools, no broken context, no surprise bills.
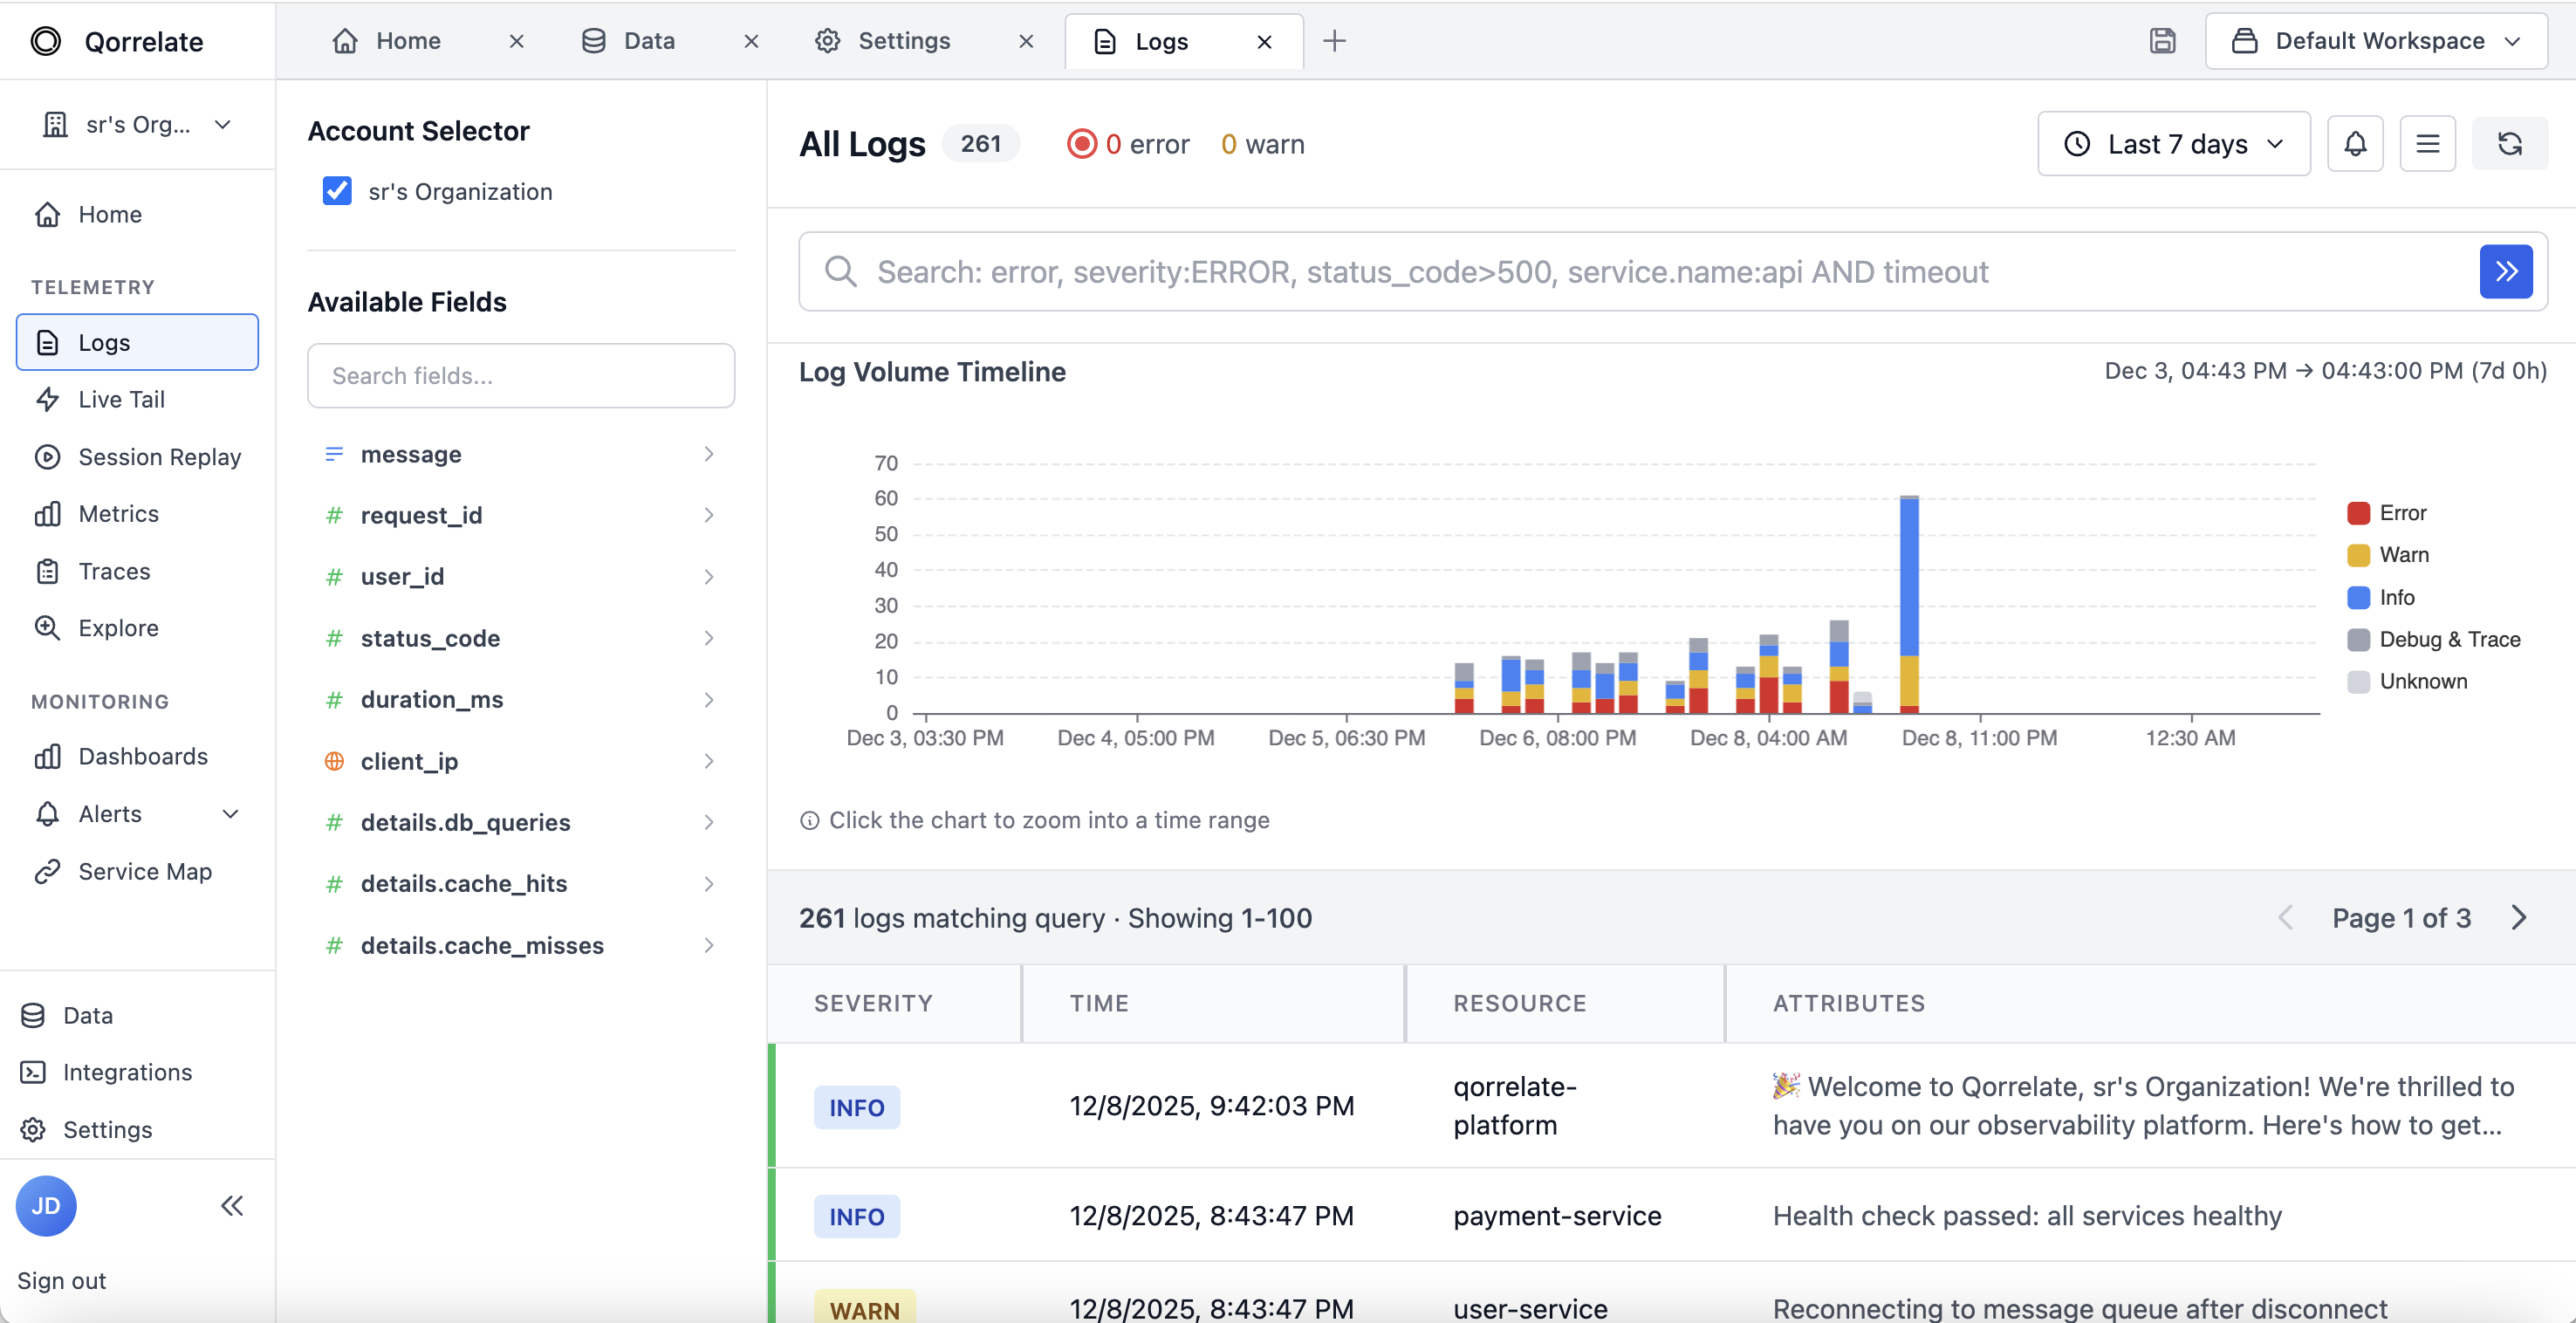
Full-text search with field-level filters, severity levels, and direct trace correlation — powered by ClickHouse for sub-second queries at any scale.
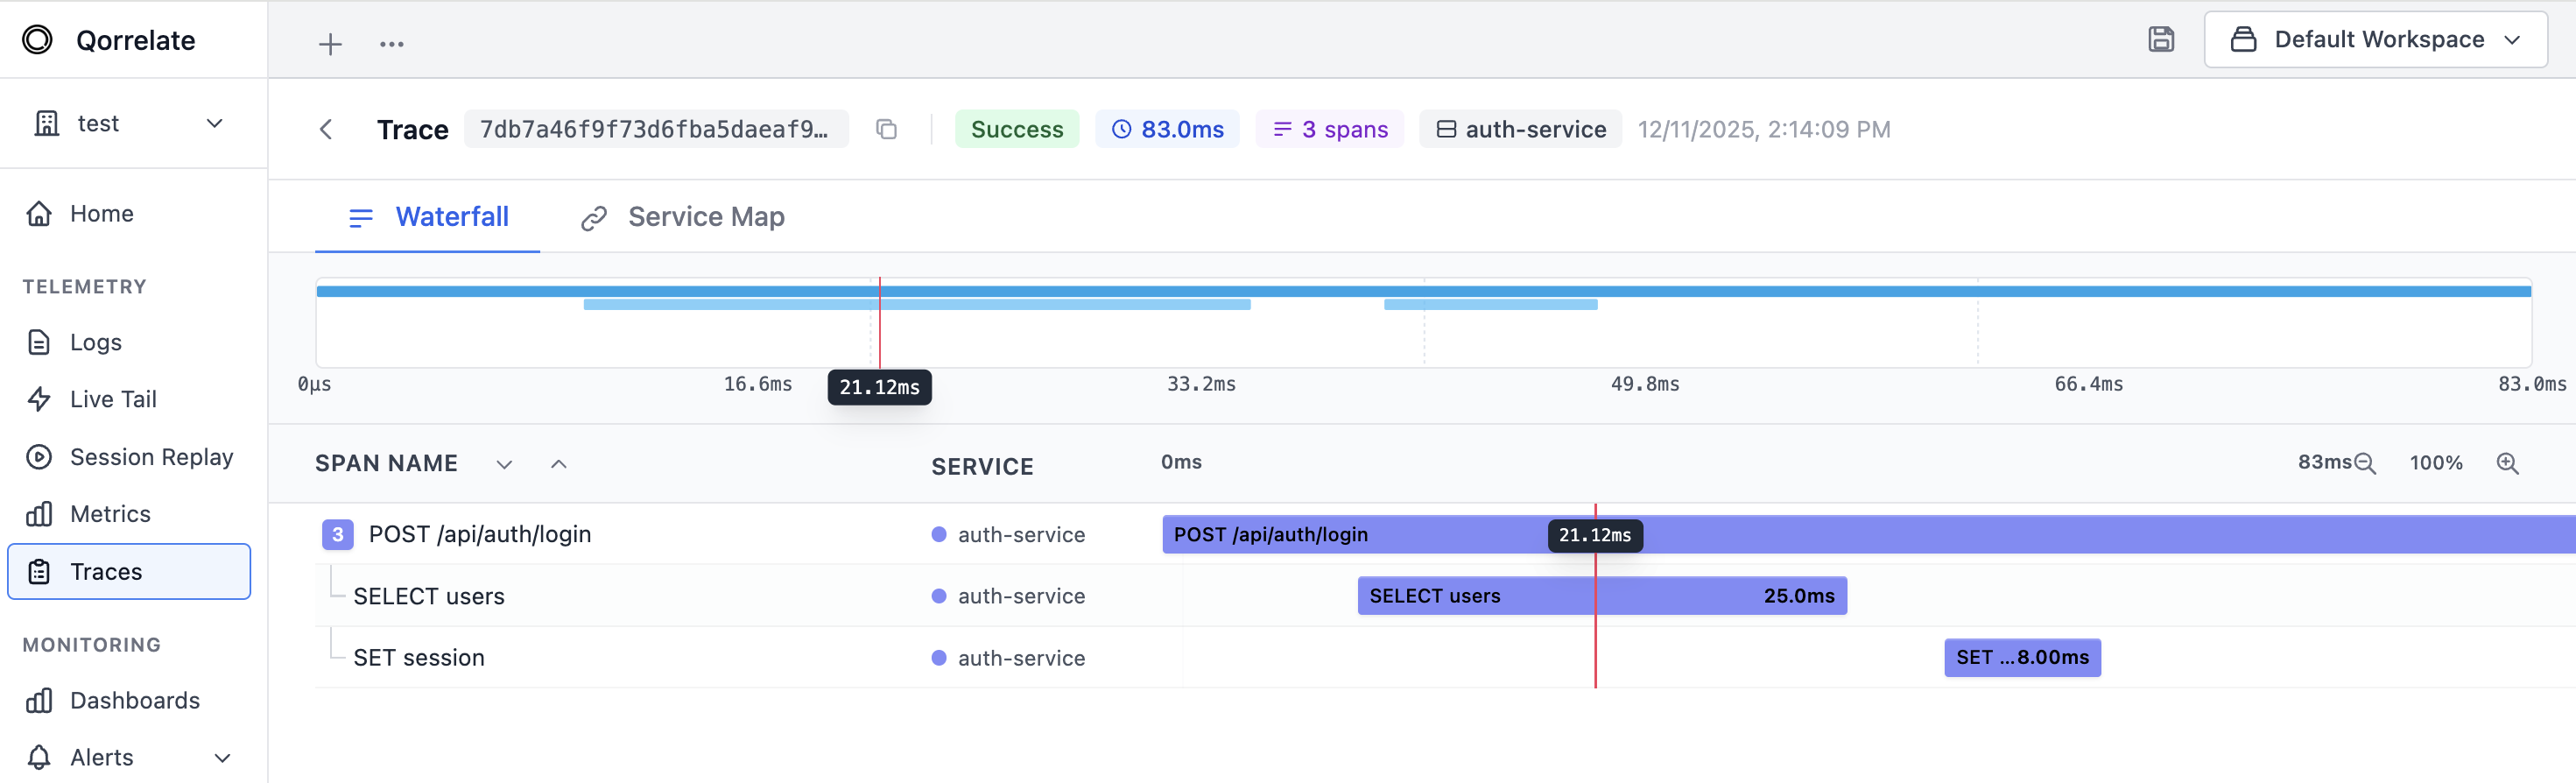
Waterfall views, service dependency graphs, and automatic error highlighting — understand every hop of every request in your distributed system.
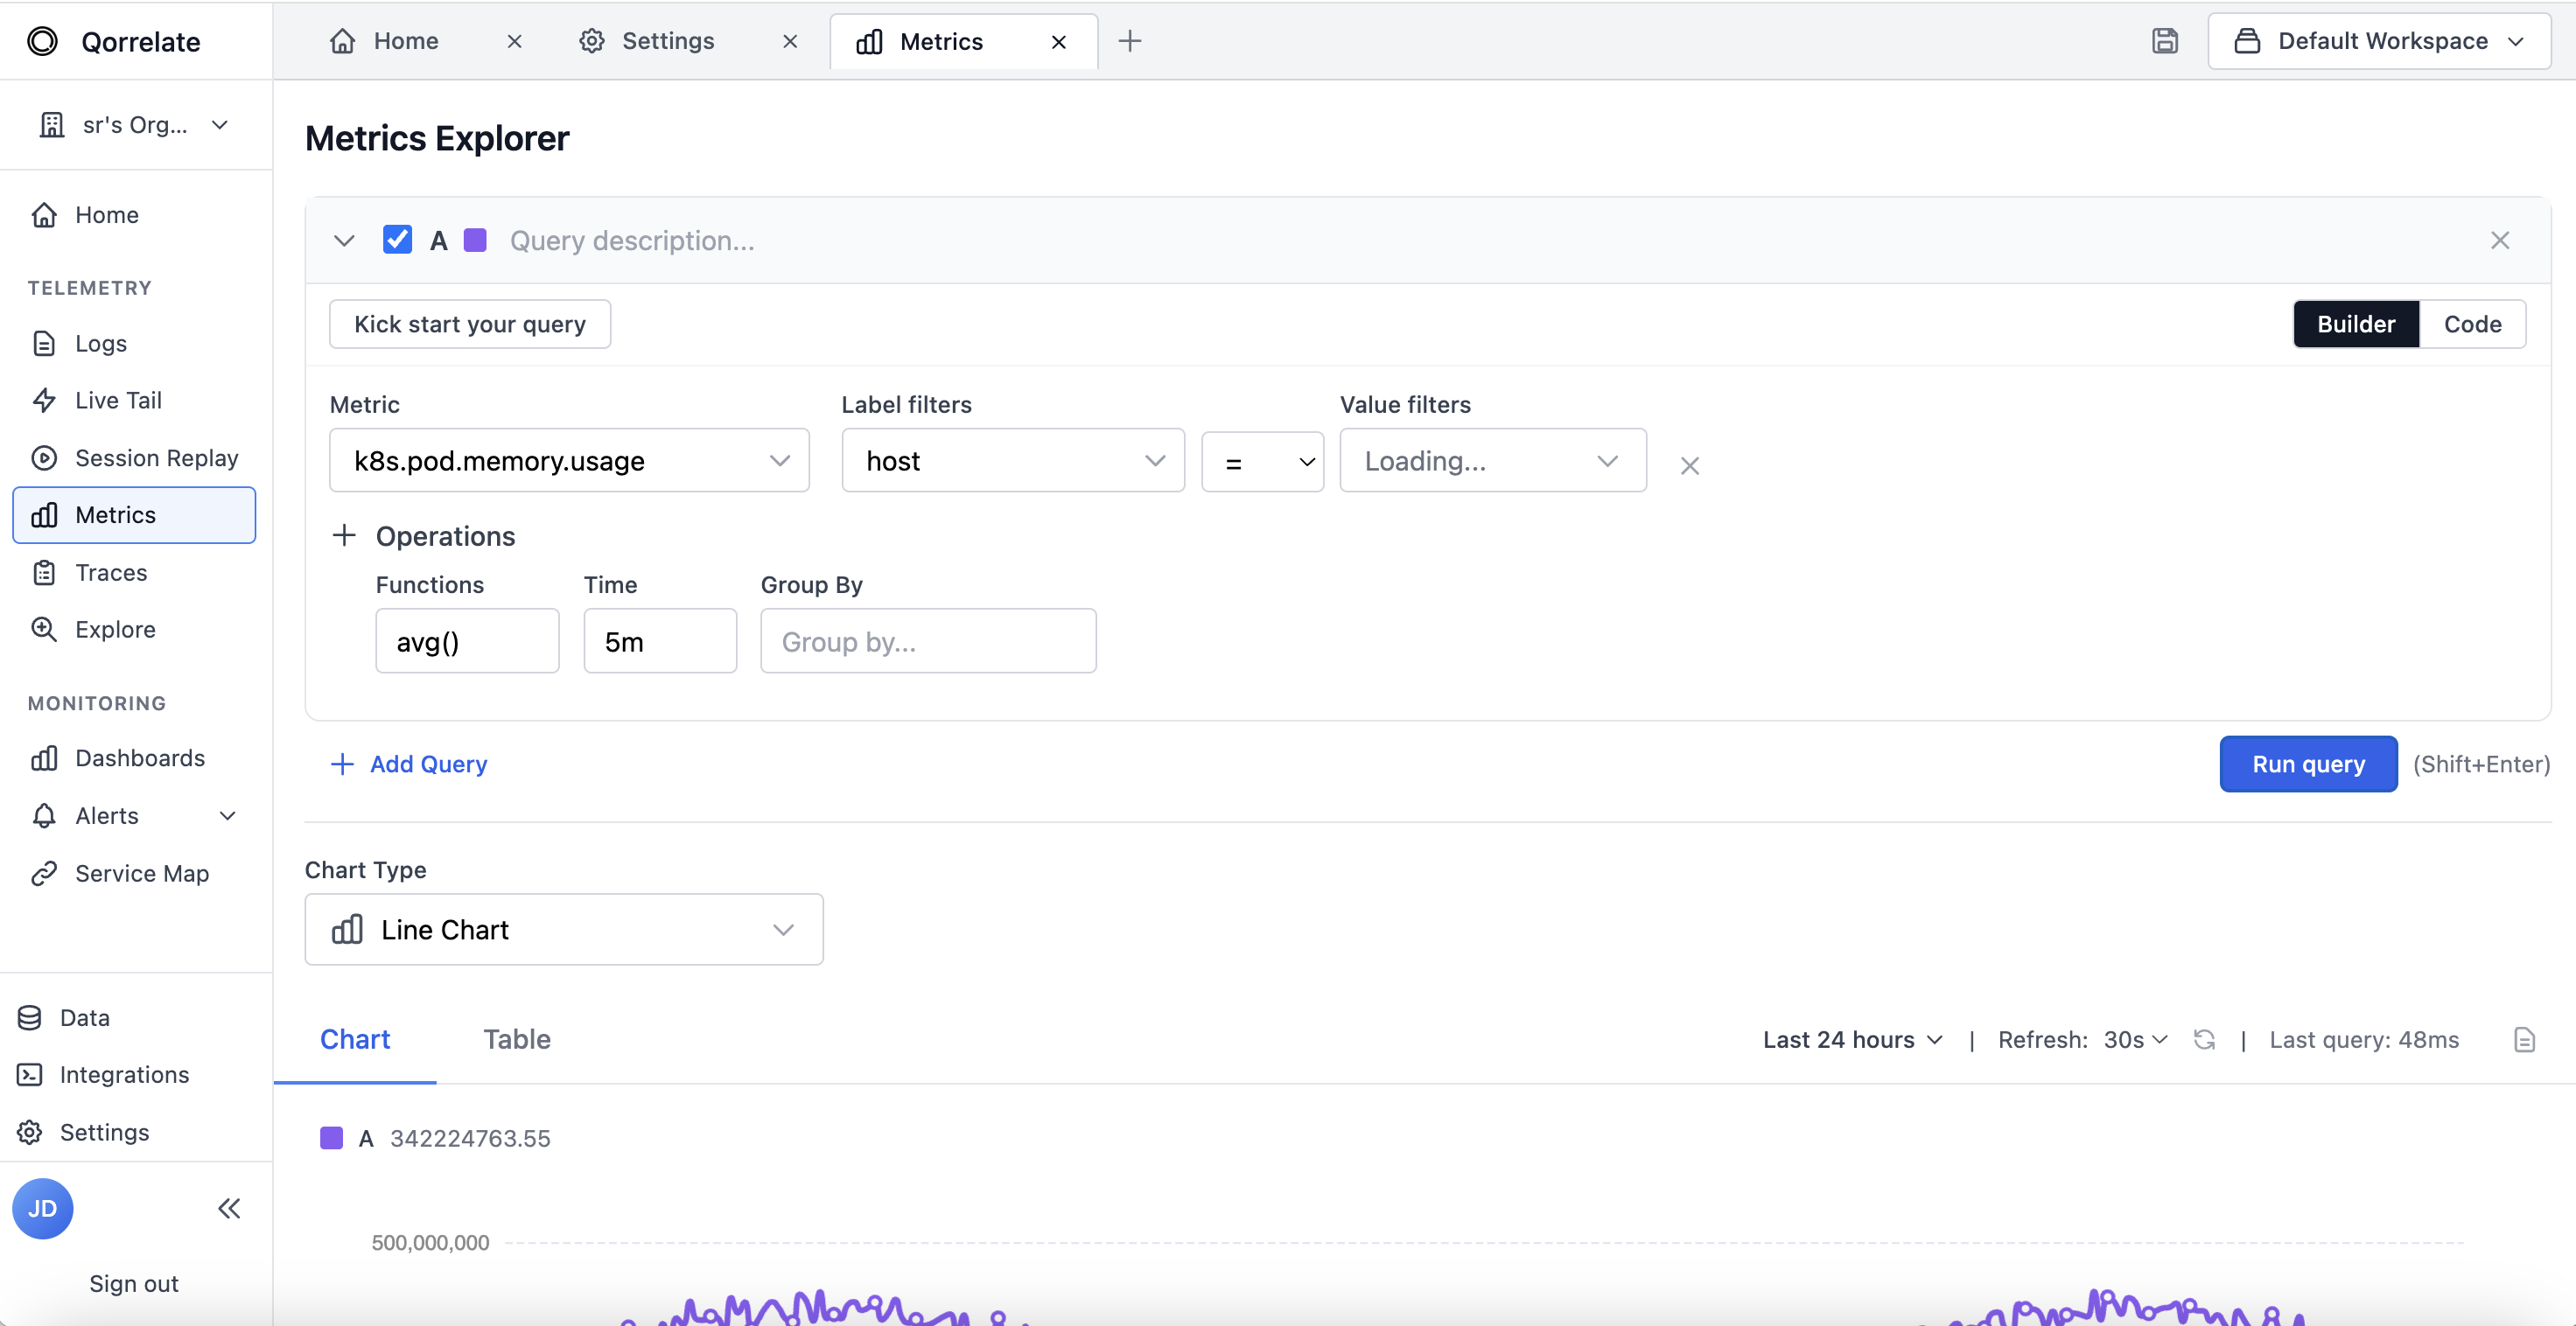
PromQL-compatible metric explorer with Perses dashboards. Monitor infrastructure, application SLOs, and custom business metrics all in one place.
Session replay, AI chat, self-hosting, and SIEM — all included, no extra tools.