From servers and containers to databases and cloud services—get complete visibility into the health and performance of every component.
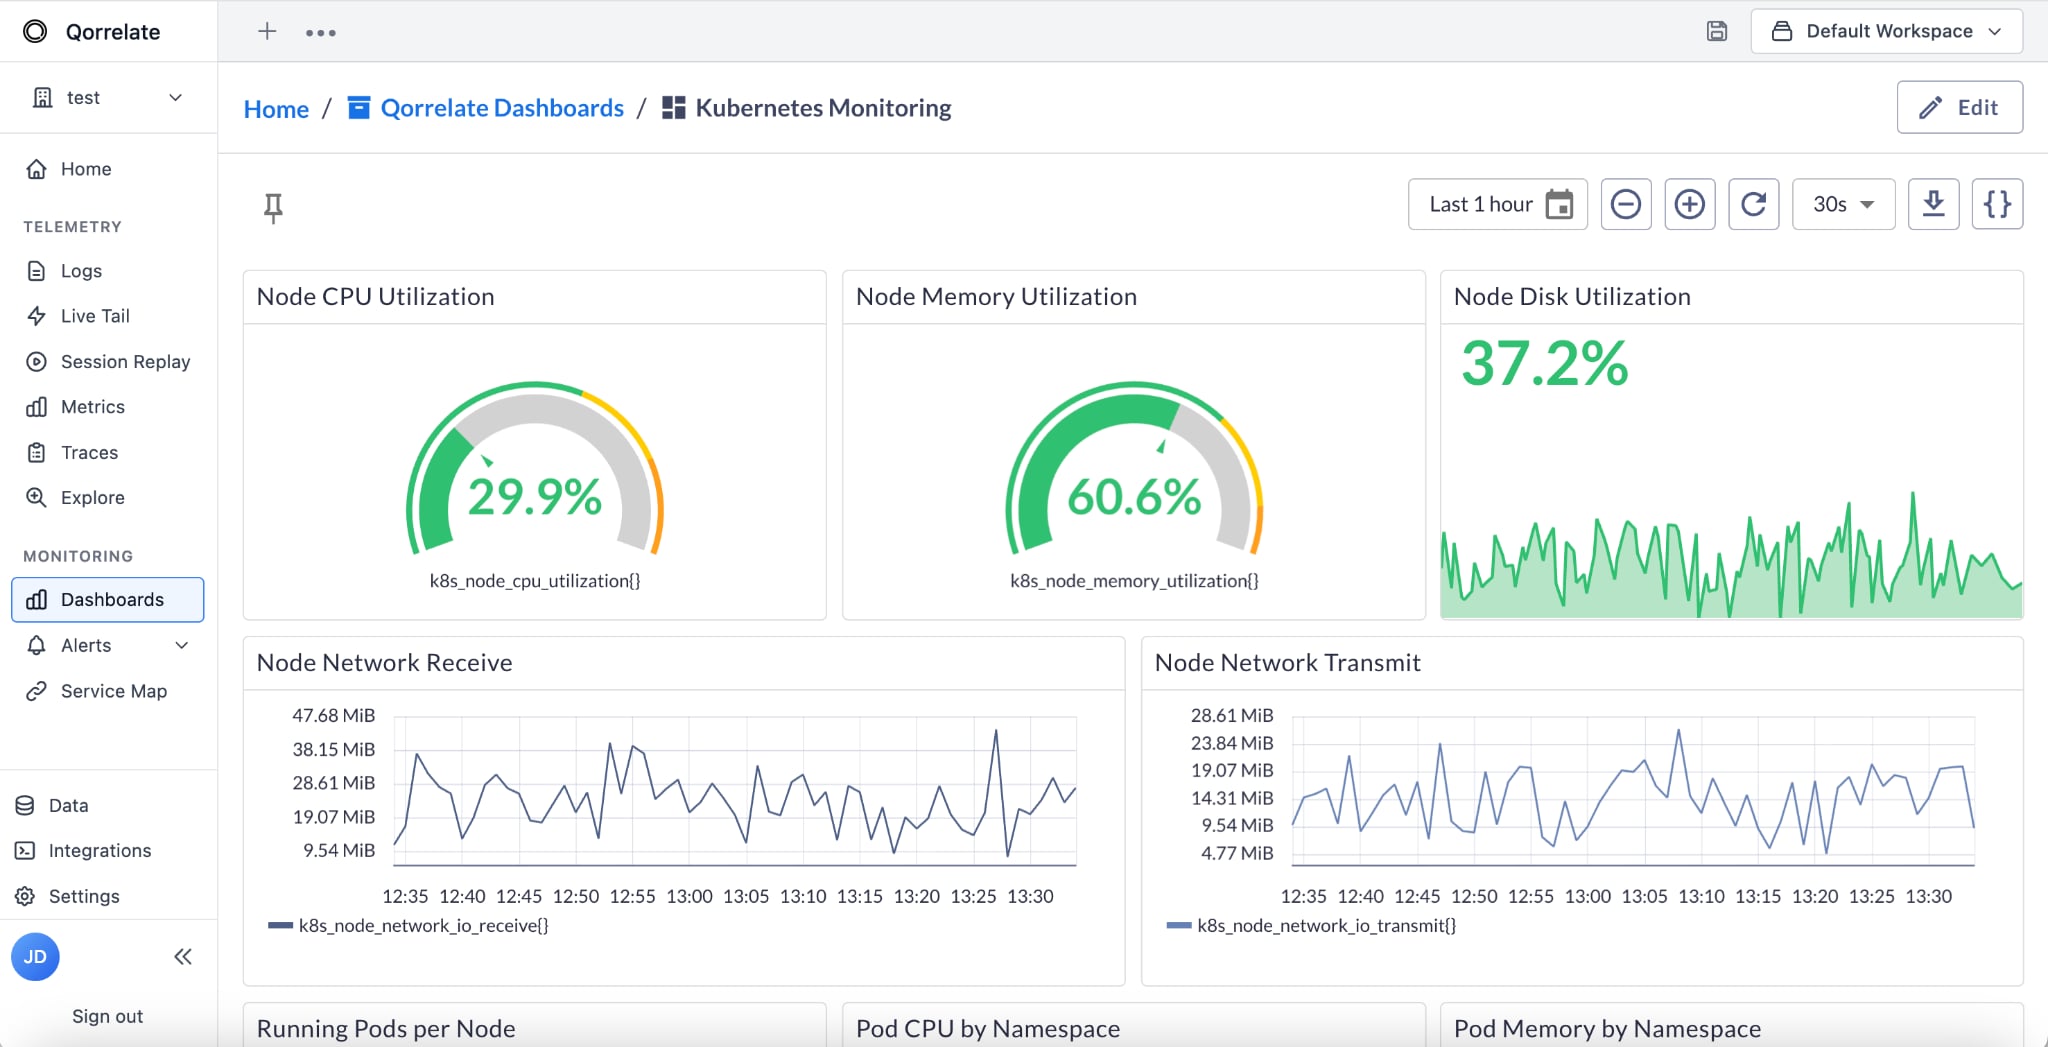
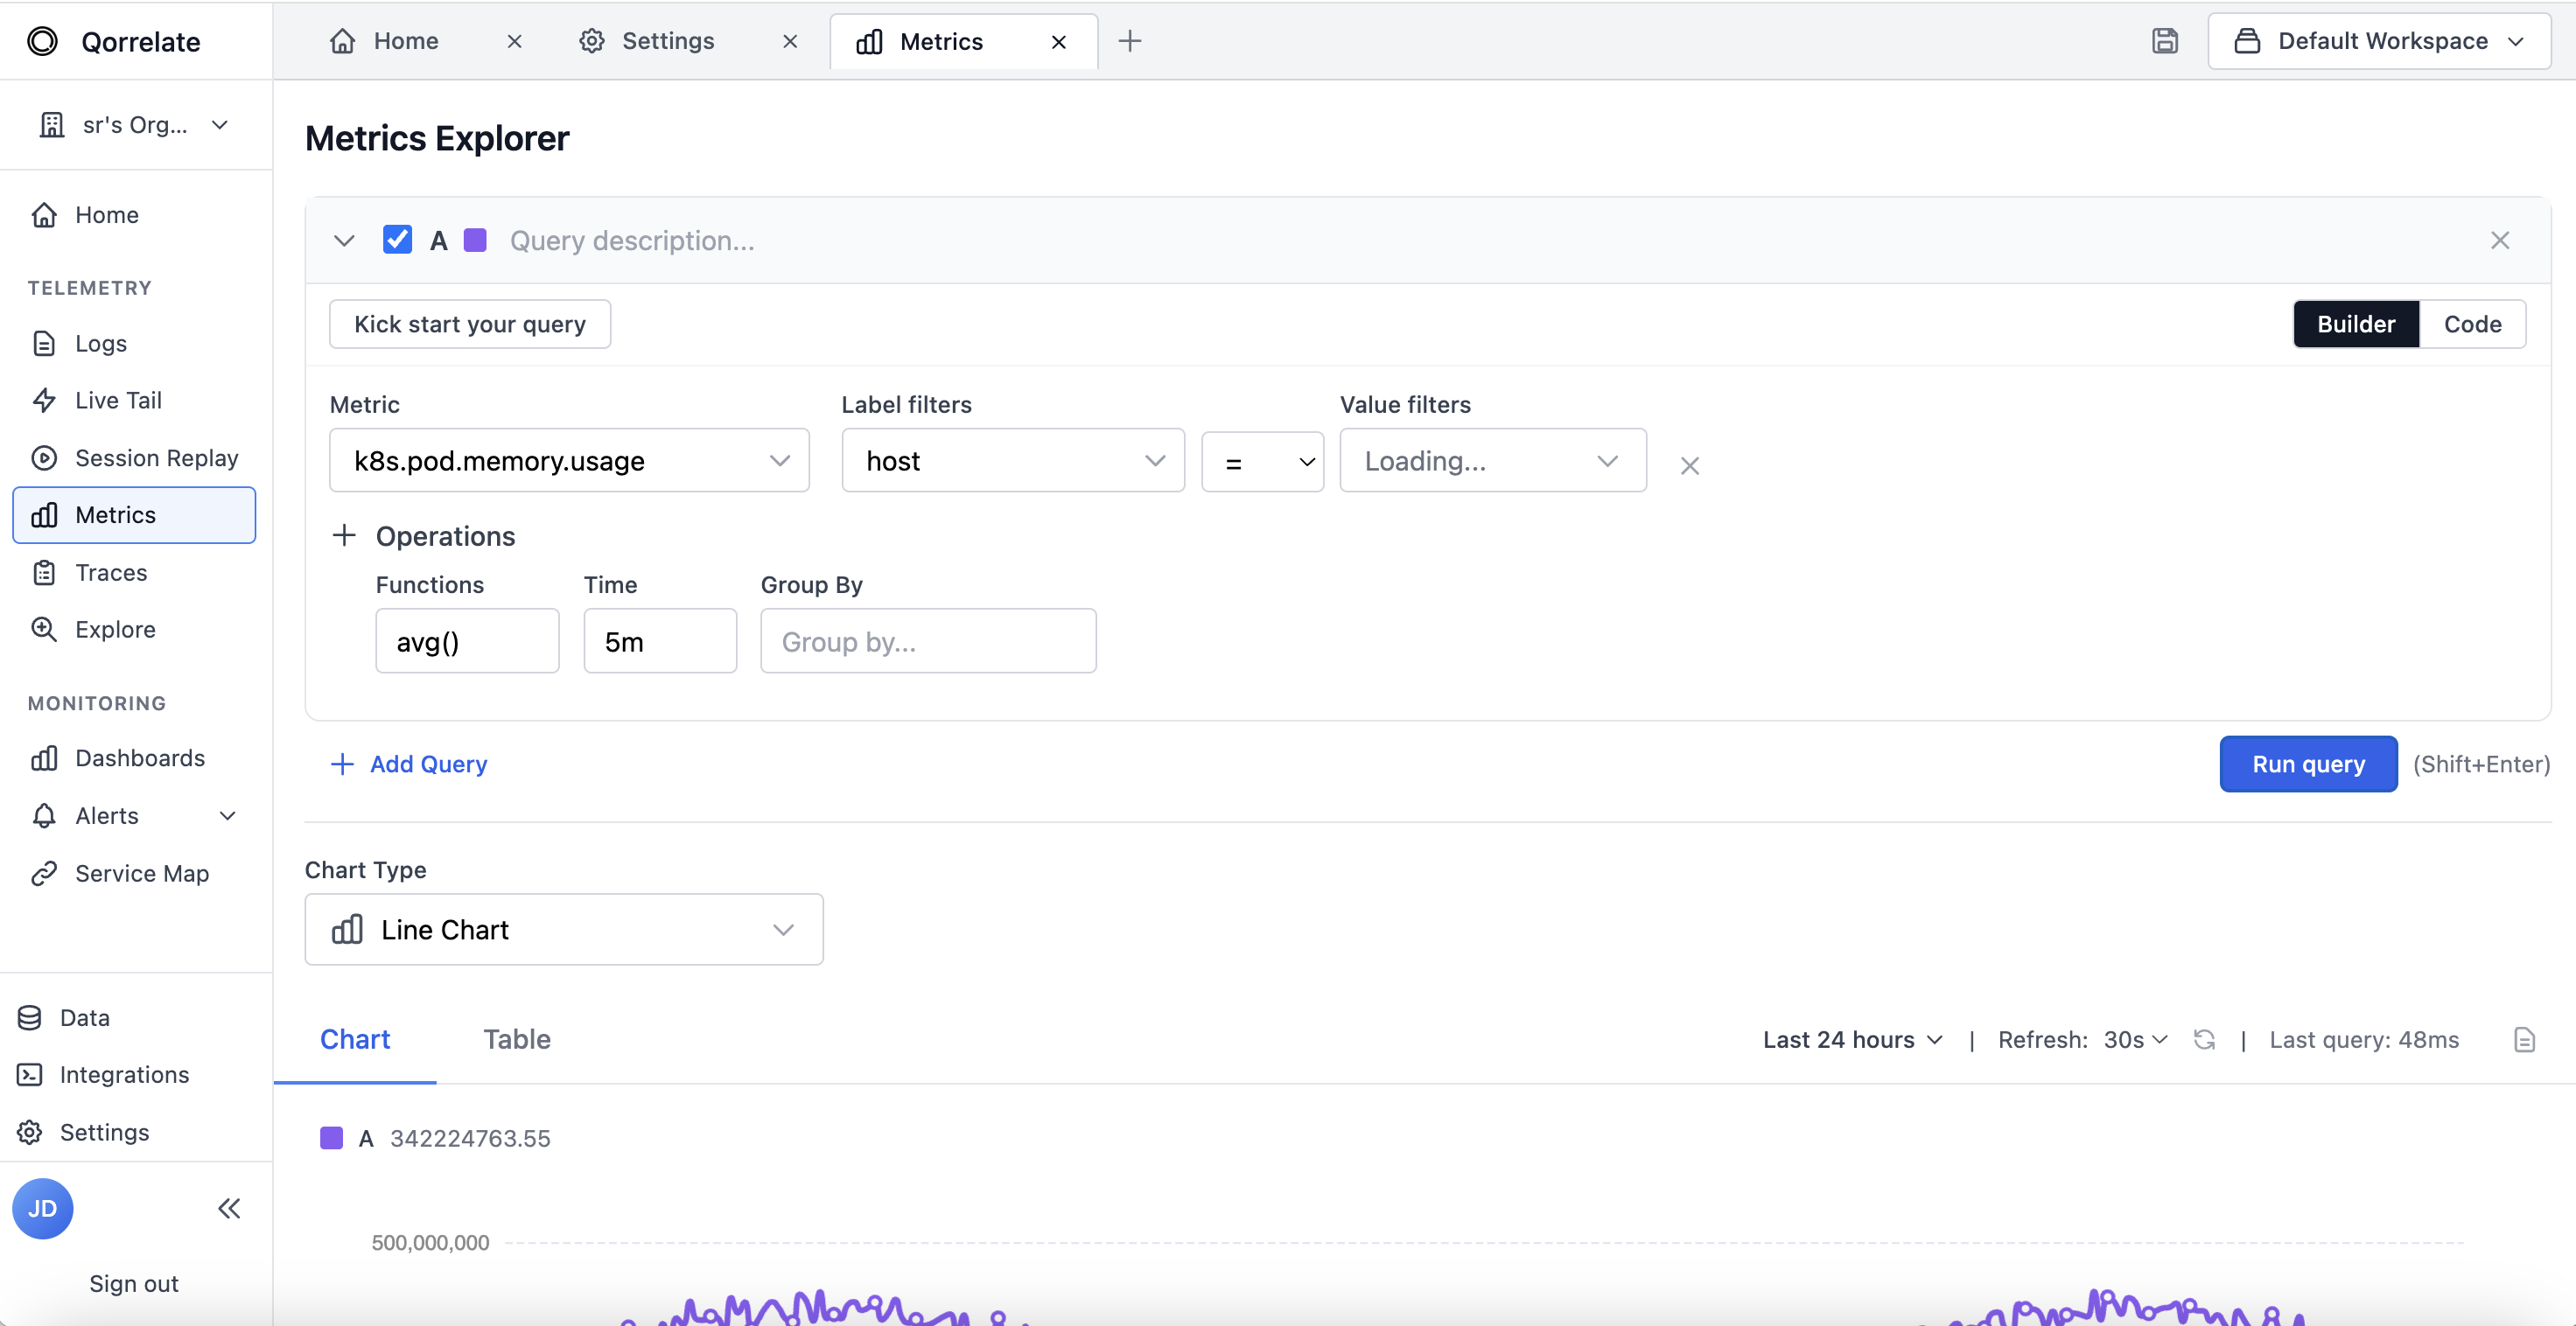
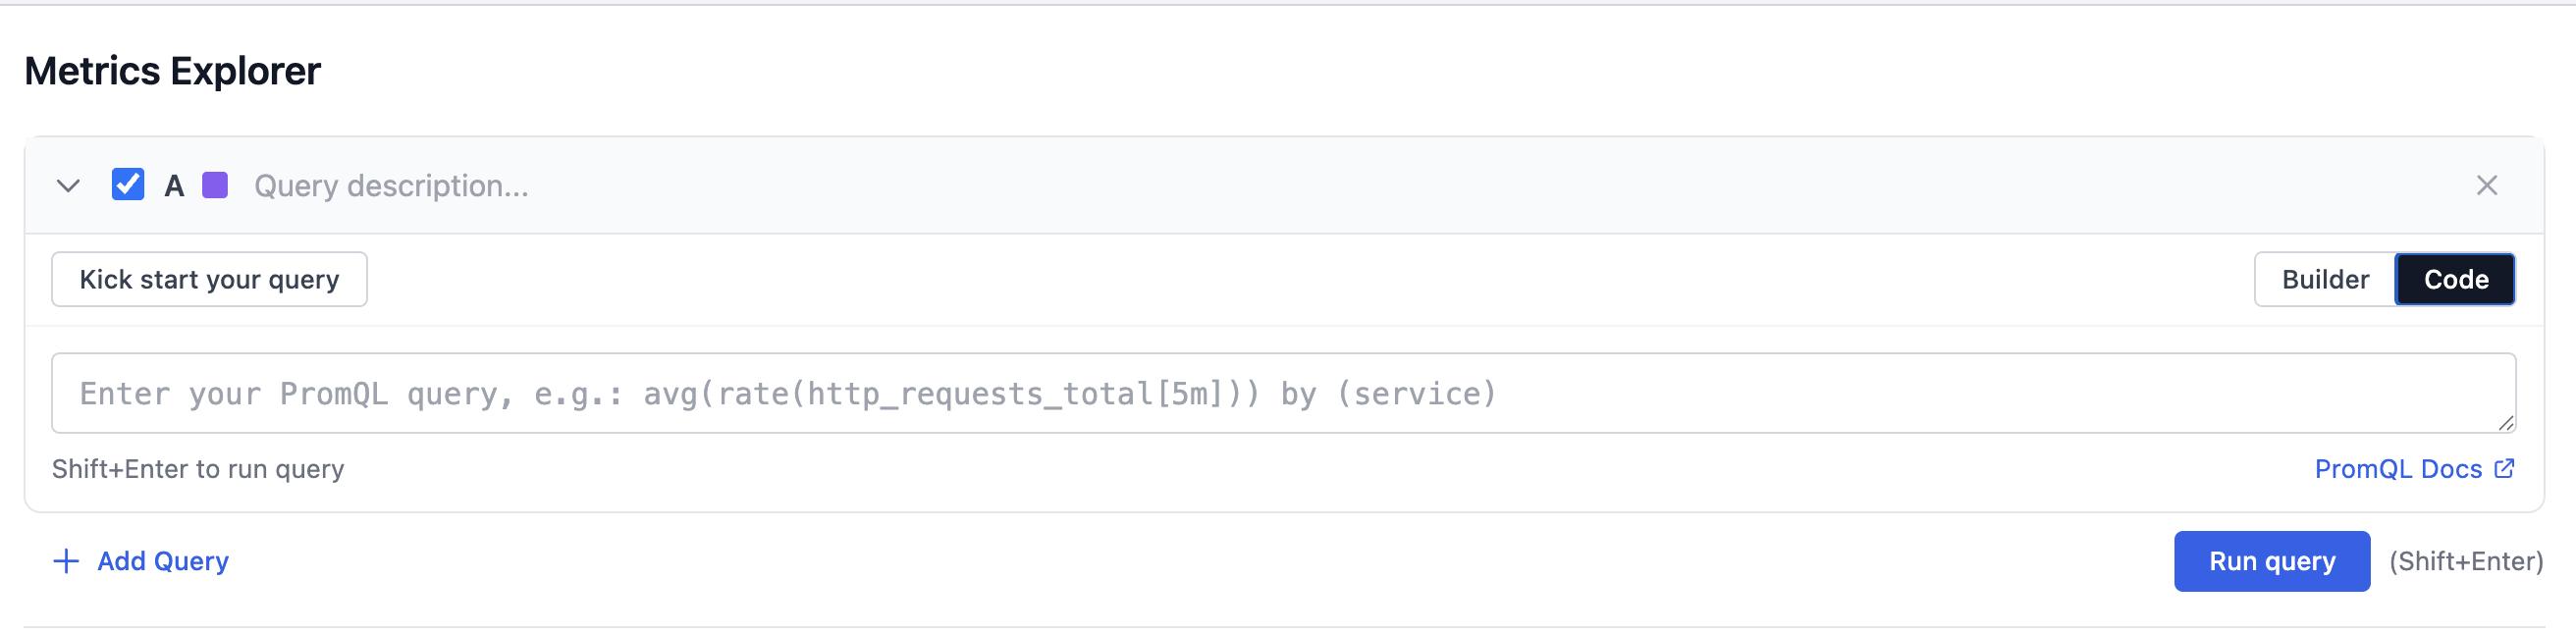
Real-Time Collection
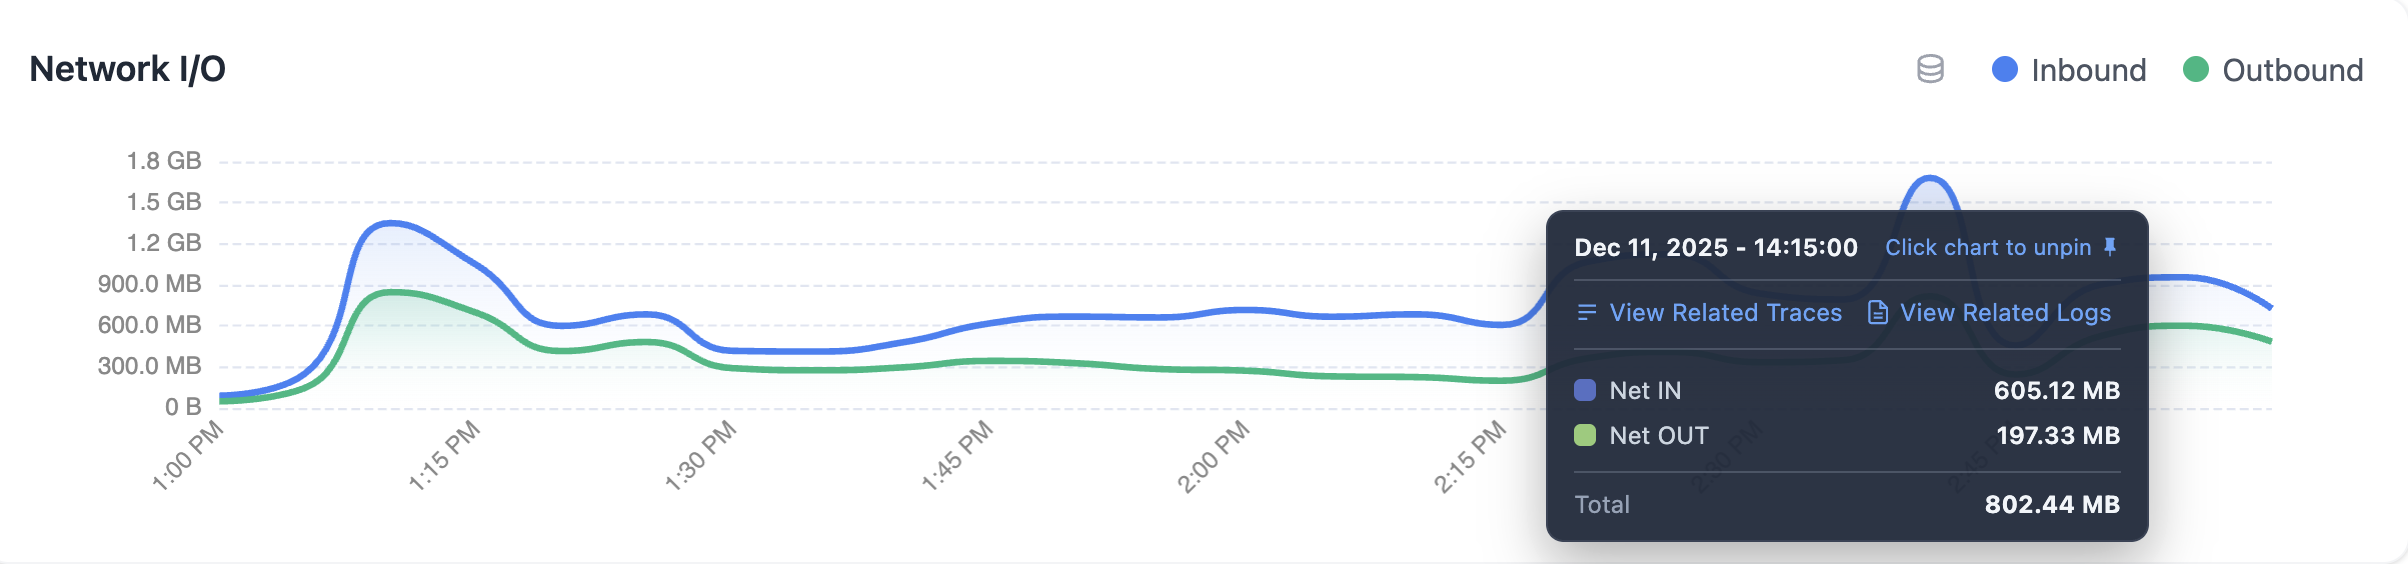
CPU, memory, disk, network, and custom application metrics—all flowing into a unified platform with sub-second granularity. Query any metric instantly with our powerful explorer.
Auto-Discovery
Automatically discover new hosts, containers, and services as they spin up. Smart tagging and grouping keeps your infrastructure organized without manual configuration.
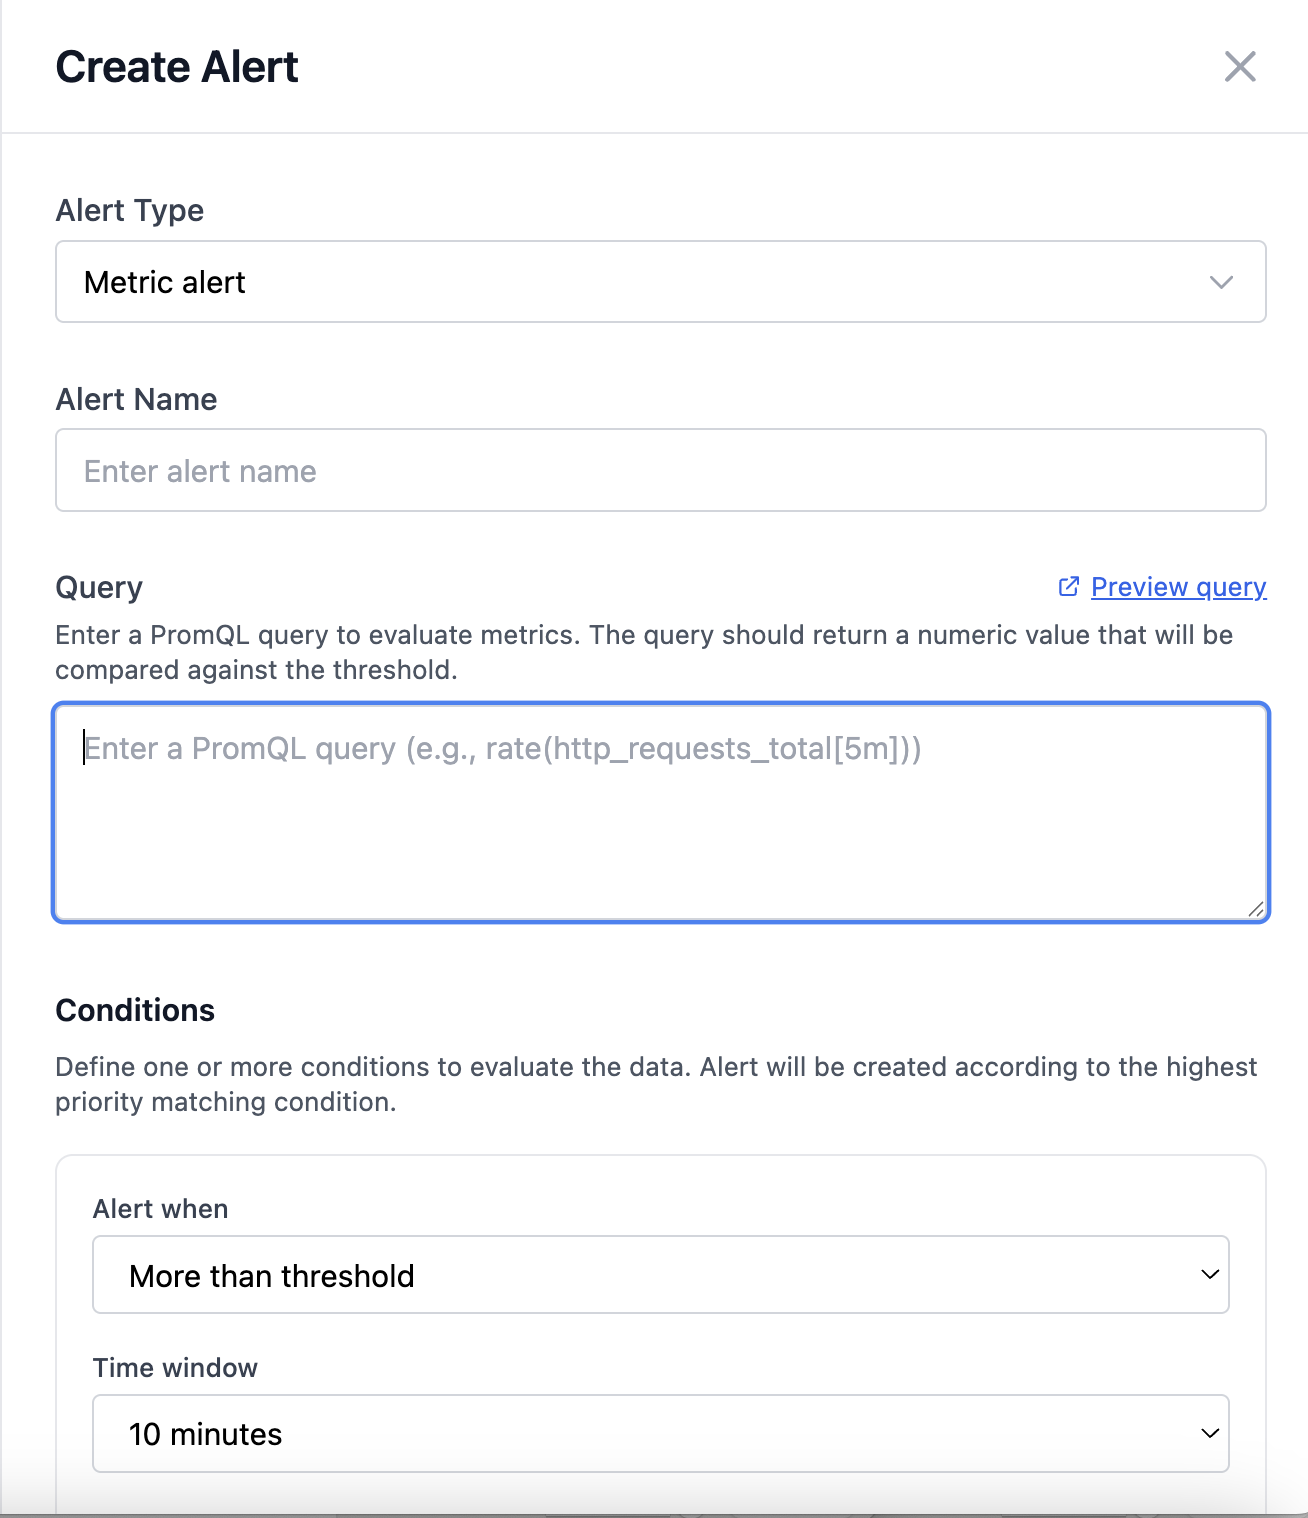
Intelligent Alerting
Anomaly detection, threshold-based alerts, and composite conditions help you catch issues before they impact users—without alert fatigue. Route to Slack, PagerDuty, or any webhook.
Full Correlation
Correlate infrastructure metrics with traces and logs. When a service slows down, instantly see if it's a code issue or a resource constraint on the underlying host.
Free to start. No credit card required. Get complete visibility in minutes.