Observability, Simplified
Qorrelate
Full-stack observability
Honeycomb
Trace-focused
All four observability signals in one platform — logs, metrics, traces, and session replay — with built-in correlation.
Your advantage: One platform for all four signals means no context switching and complete trace-to-log-to-replay correlation.
Honeycomb excels at distributed tracing but treats logs as second-class and lacks native metrics and session replay.
Why it matters: Without native log and metric support, you need separate tools — adding cost, complexity, and broken correlation.
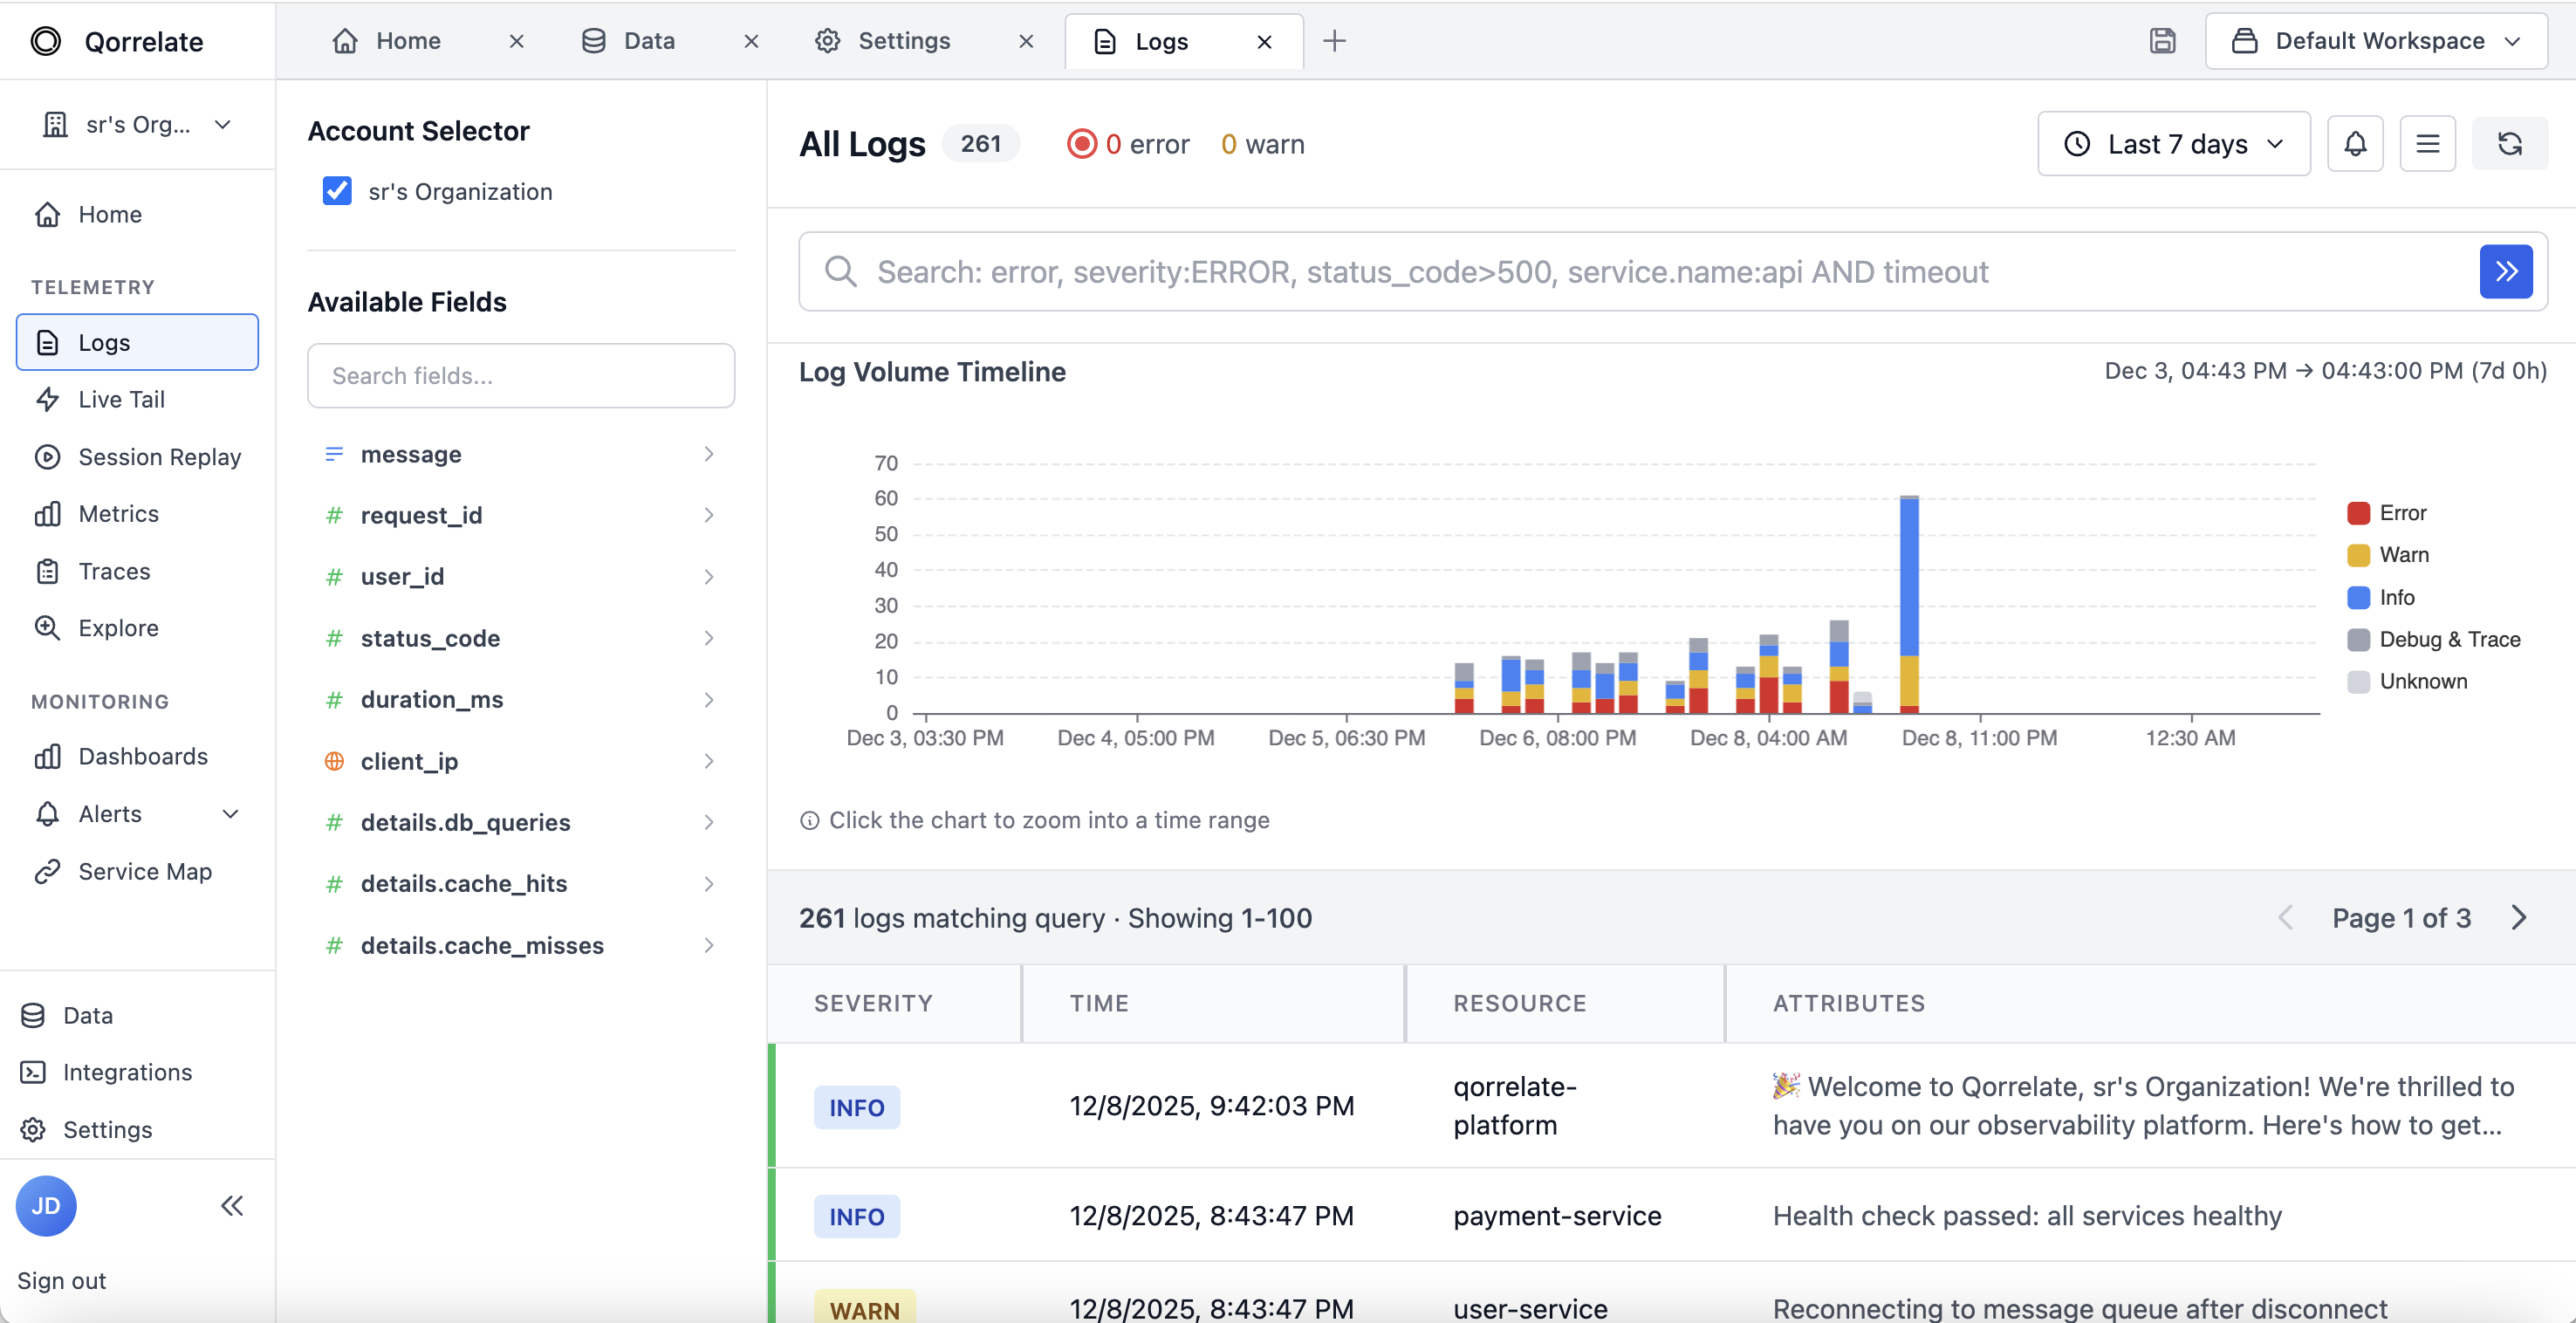
Full-featured log management with search, filtering, and correlation. Logs are first-class citizens, not an afterthought.
Your advantage: Full log search and filtering with trace correlation means you debug faster without juggling multiple tools.
Honeycomb focuses primarily on traces and events. Log support is limited and requires separate tooling for full log management.
Why it matters: Honeycomb's trace-only focus means no log management, no infrastructure metrics—forcing you into expensive multi-tool setups.
Monitor your infrastructure with Prometheus-compatible metrics. CPU, memory, disk, and network -- all in a single place.
Your advantage: Native metrics mean you monitor infrastructure and traces in one place—no Prometheus or Datadog bolt-on needed.
Honeycomb doesn't handle infrastructure metrics. You need Prometheus, Datadog, or another tool for system-level monitoring.
Why it matters: With no native infrastructure metrics, you pay for and operate multiple platforms to get full-stack visibility.
See what users experienced with built-in session replay, automatically correlated with backend traces and log data.
Your advantage: See exactly what users did when errors occurred—replay-to-trace correlation closes the frontend-to-backend debugging loop.
Honeycomb doesn't offer session replay. You need a separate tool to understand the frontend user experience.
Why it matters: Without session replay, you can't see user actions leading to errors—forcing costly FullStory or LogRocket subscriptions.
Only pay for the telemetry data you actually use, after filtering out noise with the built-in spam filter.
Your advantage: Drop filters and sampling before ingestion—you only pay for actionable data, not noise.
You pay for all ingested data upfront, regardless of any filtering applied within Honeycomb after ingestion.
Why it matters: Honeycomb's pay-for-ingestion model means you're billed for every event—including data you later filter out or never query.
See how we compare on the features that matter
| Features | Honeycomb |
|
|---|---|---|
| Easy to set up and use | ||
| OpenTelemetry-native | ||
| Full log management | ||
| Infrastructure metrics | ||
| Session replay | ||
| Self-hosted option | ||
| Transparent pricing |
No complex setups, no maintenance – all the context for your logs, metrics and traces.
Manage diverse logs with the fastest search and filtering capabilities. Leverage OpenTelemetry semantic conventions for context.
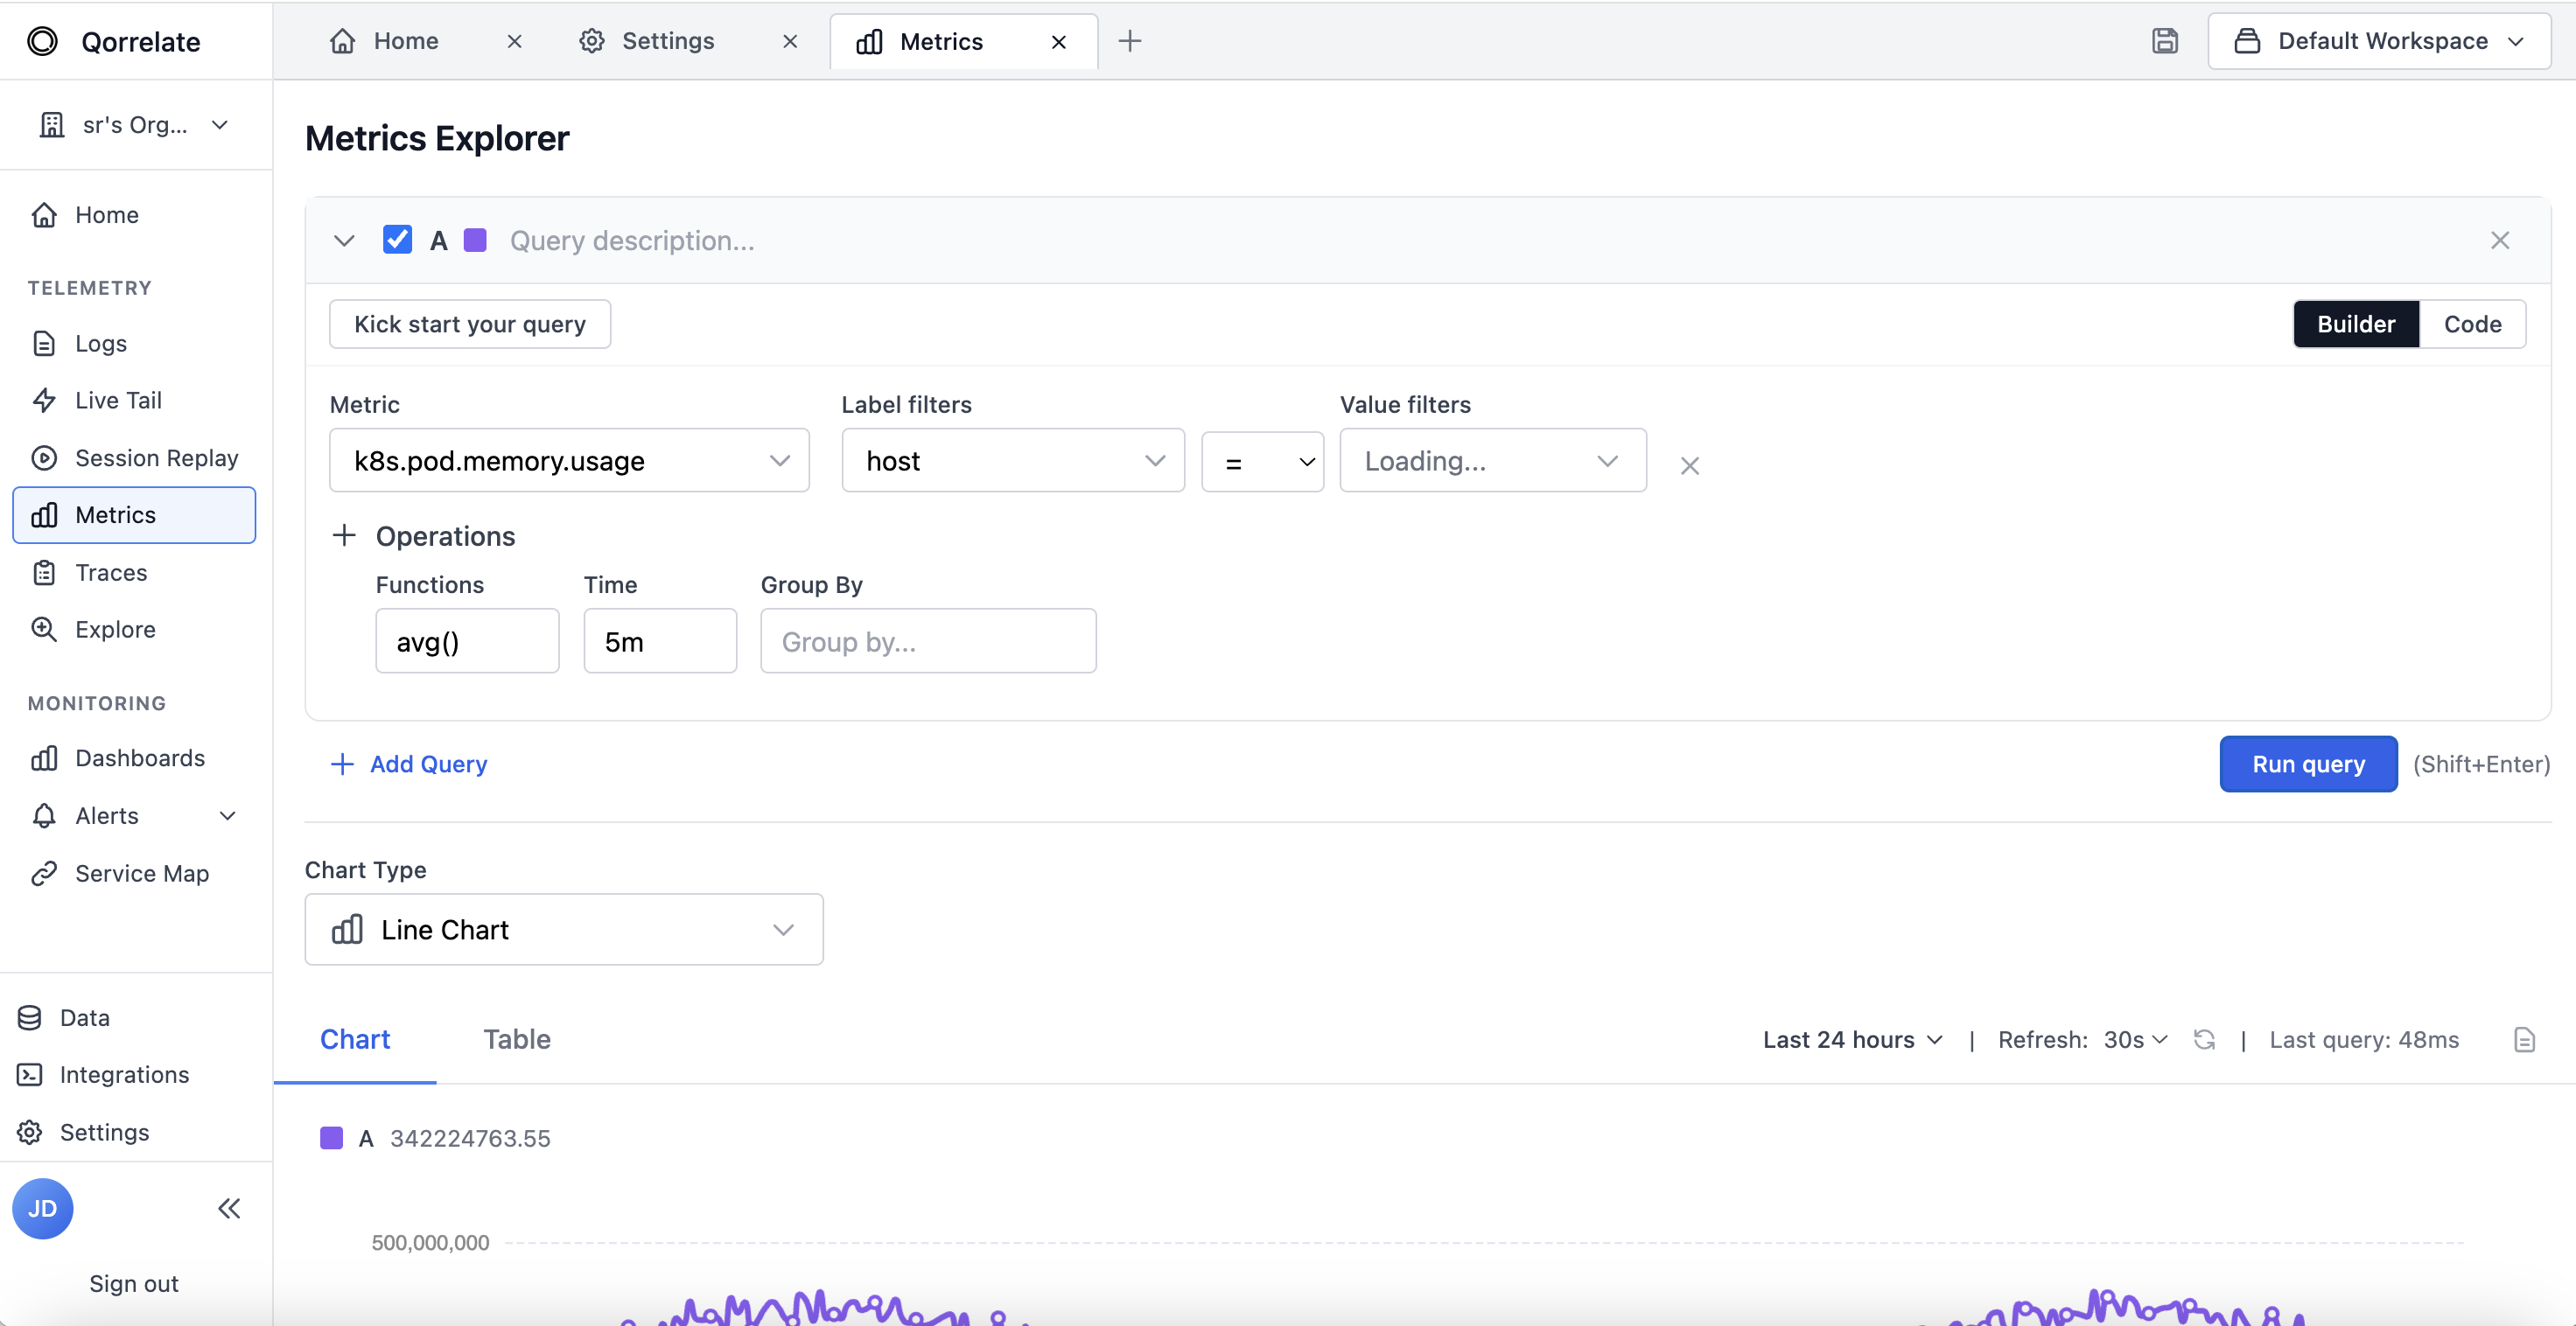
Centralize Prometheus & OpenTelemetry metrics to monitor your infrastructure and service with ease.
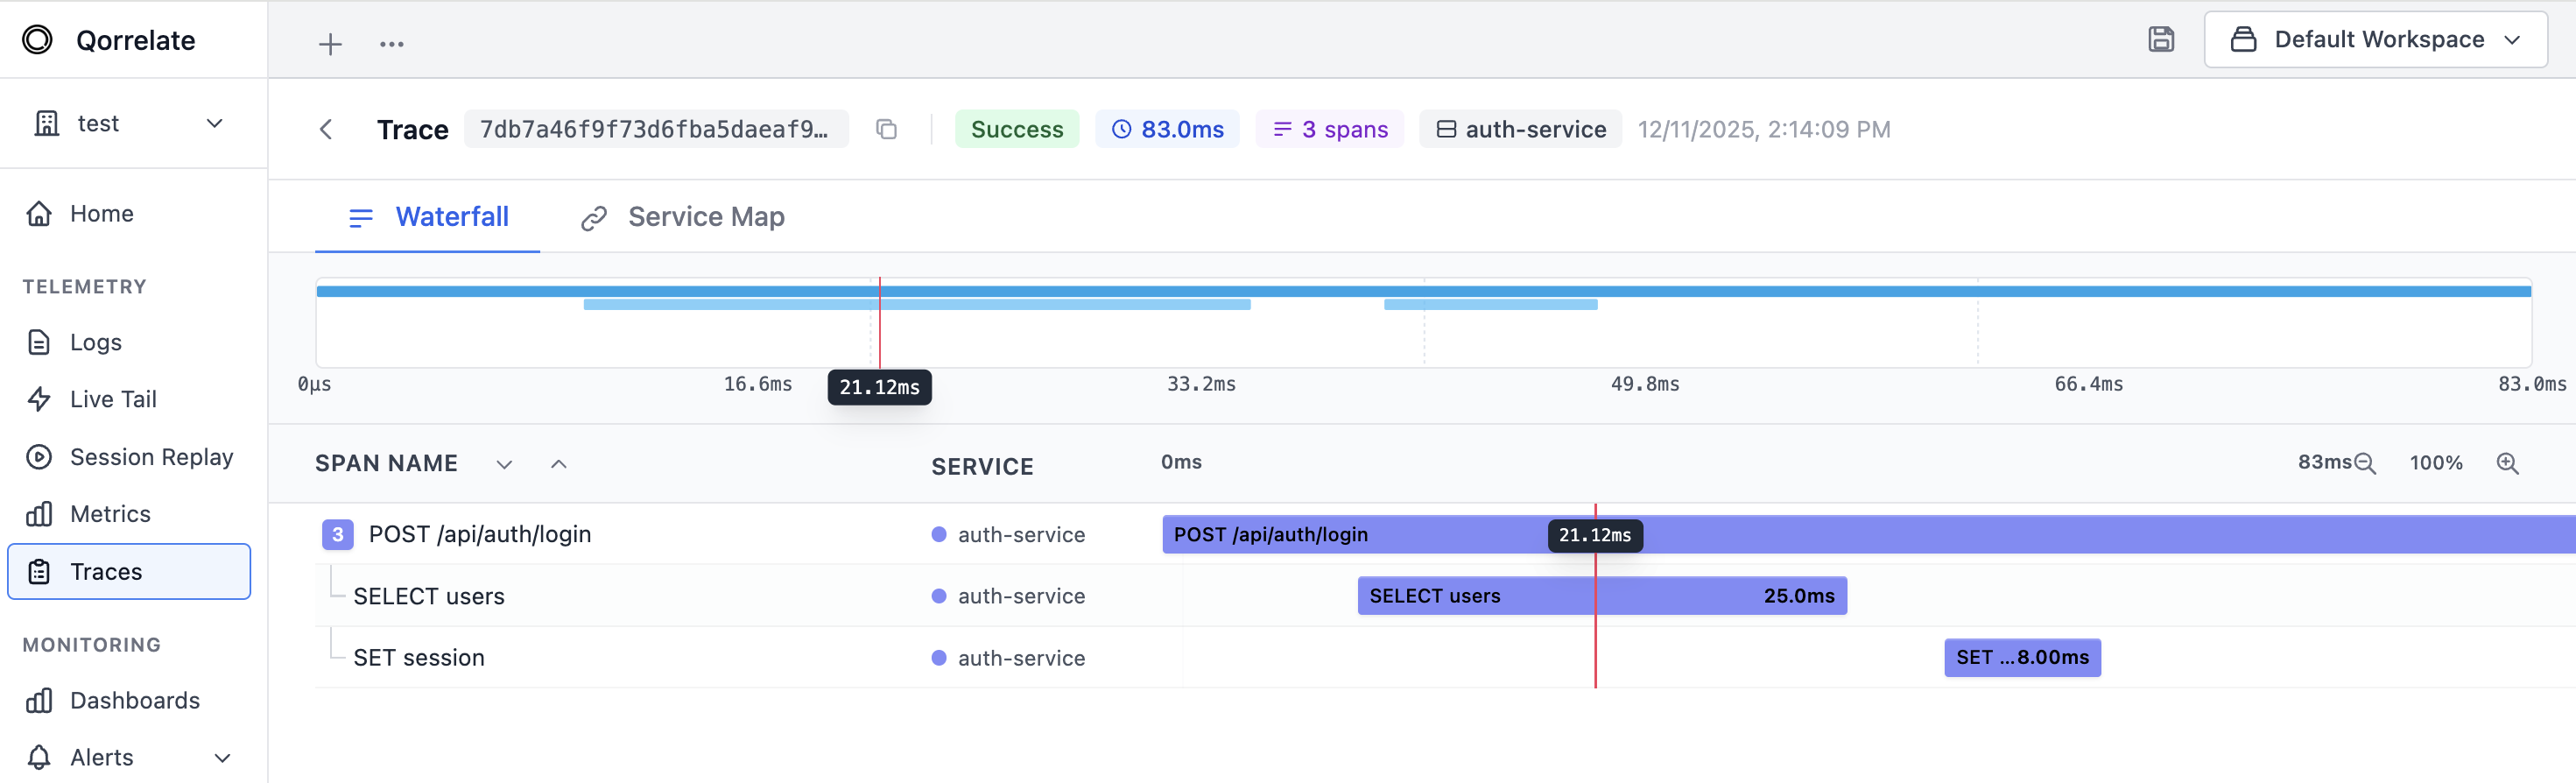
Spot errors and bottlenecks: real-time search and filtering capabilities for all high cardinal attributes.
Get started in minutes with OpenTelemetry-native monitoring