Let AI Handle Your SRE
Qorrelate
AI agent-first observability

Datadog
Enterprise monitoring and security
OpenTelemetry-native platform for seamless, standardized data collection and interoperability across cloud and distributed systems.
Your advantage: Standard OTel names mean portable dashboards, community runbooks, and zero rewriting when switching backends.
Datadog's OTel support is secondary to proprietary agents, adding configuration complexity and unexpected billing surprises.
Why it matters: Every renamed attribute means rewriting dashboards, alerts, and queries if you ever switch. OTel standards keep your data portable across any backend.
Transparent pricing with built-in cost control: quotas, drop filters, budget alerts, and real-time usage dashboards.
Your advantage: Budget caps, drop filters, and real-time usage dashboards keep costs predictable month after month.
Customers pay for ingestion, storage, retention, and pipelines separately. Pricing varies by metric series count.
Why it matters: Hidden fees for custom metrics, indexed logs, and APM hosts make monthly bills unpredictable and hard to forecast.
Intuitive, minimalist UI with smart color cues, keyboard navigation, and effortless querying. No training required.
Your advantage: Clean interface with smart defaults means your team is productive on day one — no certification needed.
Enterprise-focused interface with a steep learning curve due to complex navigation, terminology, and configuration.
Why it matters: Complex navigation and steep learning curves mean weeks of onboarding before teams can use the platform effectively.
Built on OpenTelemetry and Prometheus for flexibility, interoperability, and future-proof observability – no vendor lock-in.


Your advantage: Open standards mean your dashboards, alerts, and queries work with any OTel-compatible backend — switch anytime.
Proprietary agents, queries, dashboards, and alert configs that are costly and complex to migrate away from.
Why it matters: Proprietary agents, query language, and dashboard formats create high switching costs that grow over time.
Built-in cost control: utility scoring finds low-value data, drop filters remove noise, and you only pay for what's left.
Your advantage: Built-in utility scoring and drop filters eliminate noise before billing — you only pay for data that matters.
You pay for all ingested data upfront, regardless of any filtering mechanisms applied within Datadog after ingestion.
Why it matters: Paying for all ingested data means 40-60% of your bill goes toward telemetry no one ever queries.
See how we compare on the features that matter
| Features |
|
Datadog
|
|---|---|---|
| Easy to set up and use | ||
| OpenTelemetry-native | ||
| Transparent pricing | ||
| Full resource-based context and navigation | ||
| Self-hosted option | ||
| Telemetry spam filter | ||
| AI-powered log analysis | ||
| No vendor lock-in |
No complex setups, no maintenance – all the context for your logs, metrics and traces.
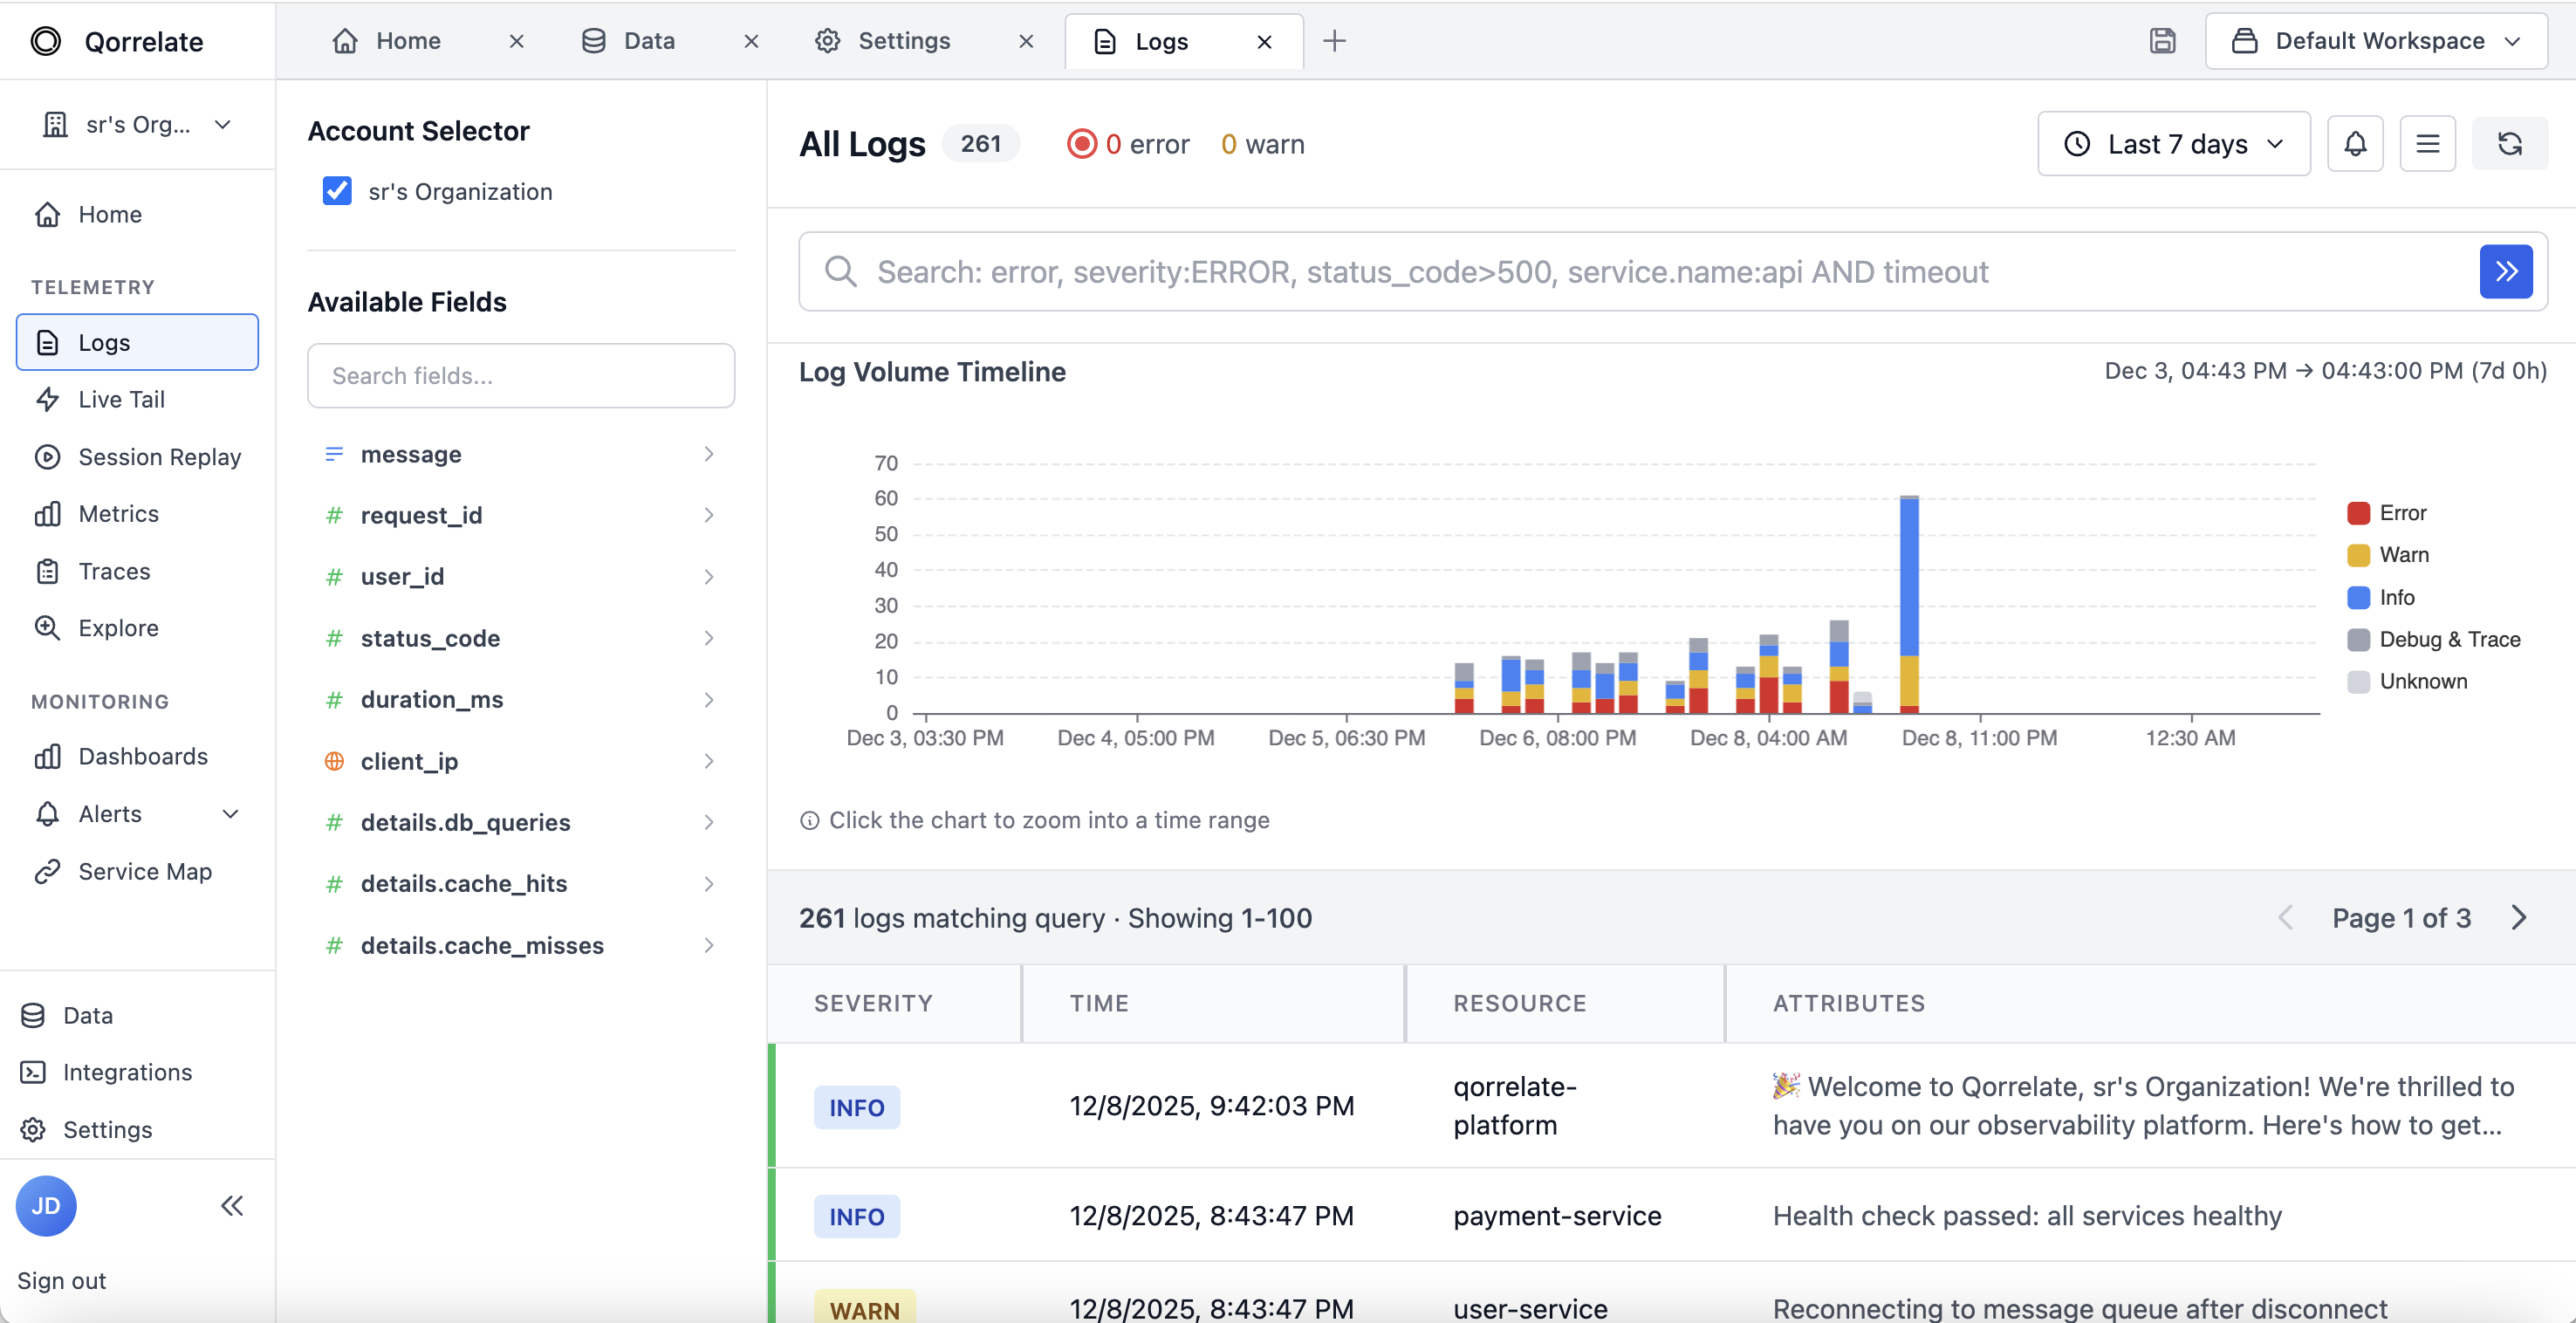
Manage diverse logs with the fastest search and filtering capabilities. Leverage OpenTelemetry semantic conventions for context, traces, and metrics, to spot patterns in a blink.
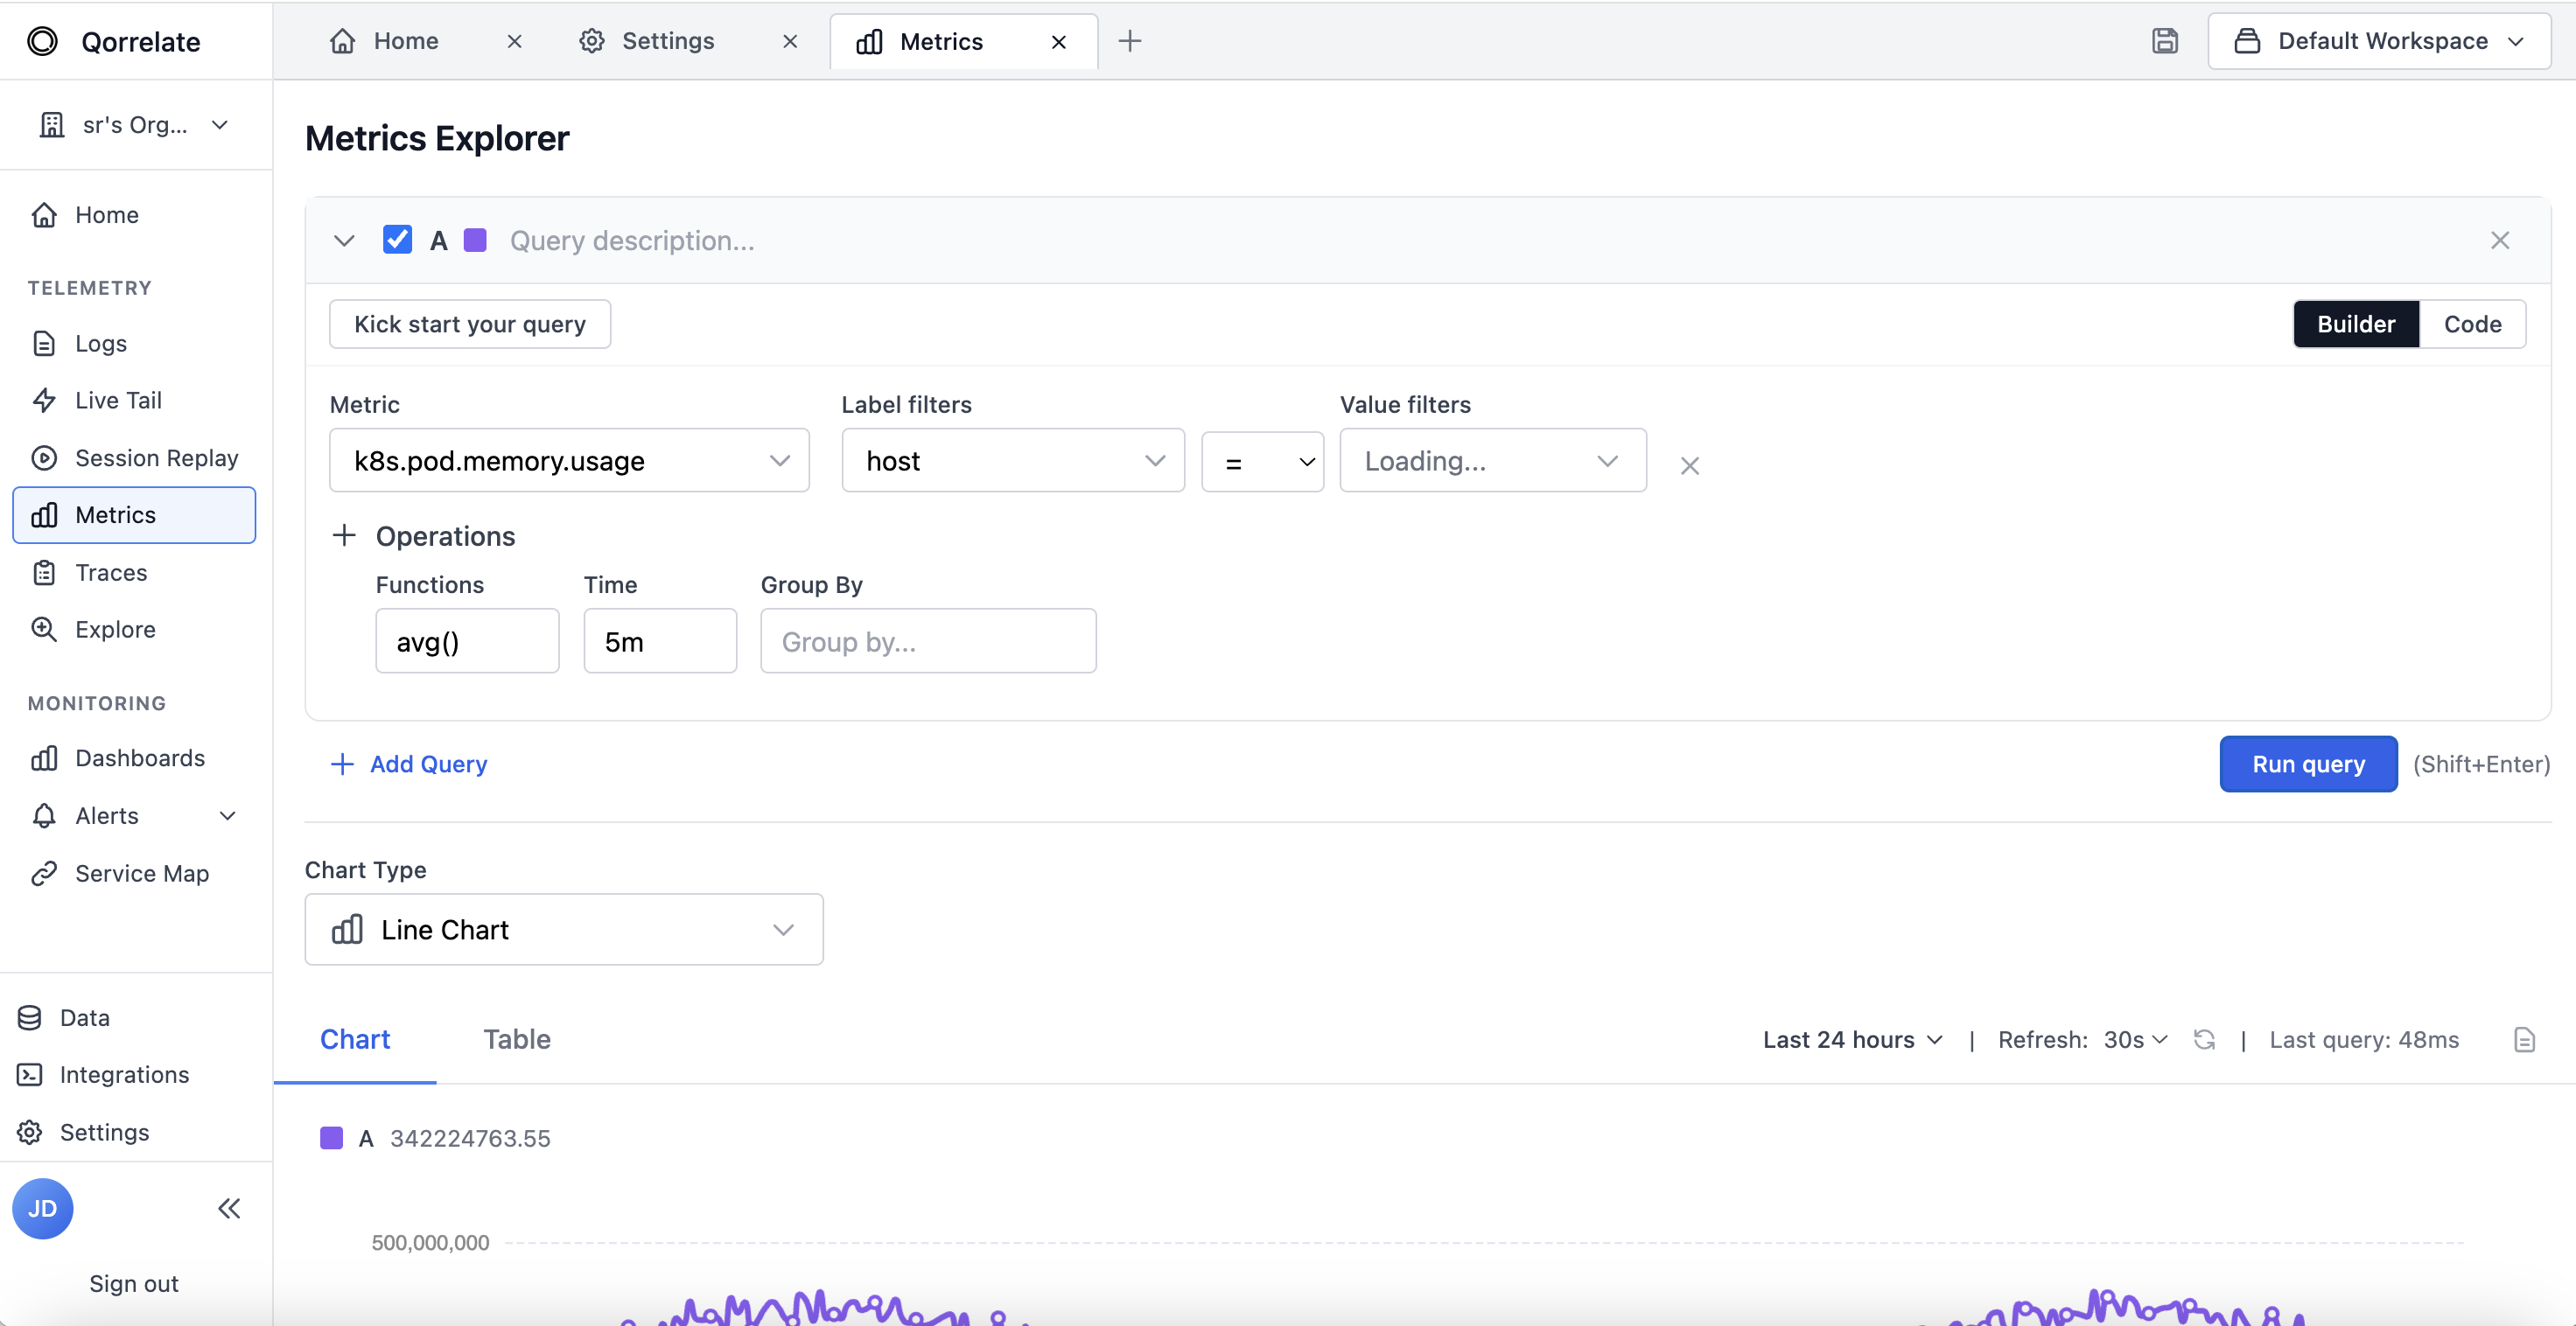
Centralize Prometheus & OpenTelemetry metrics to monitor your infrastructure and service with ease. Use proven dashboards, integrations and alerts with full context.
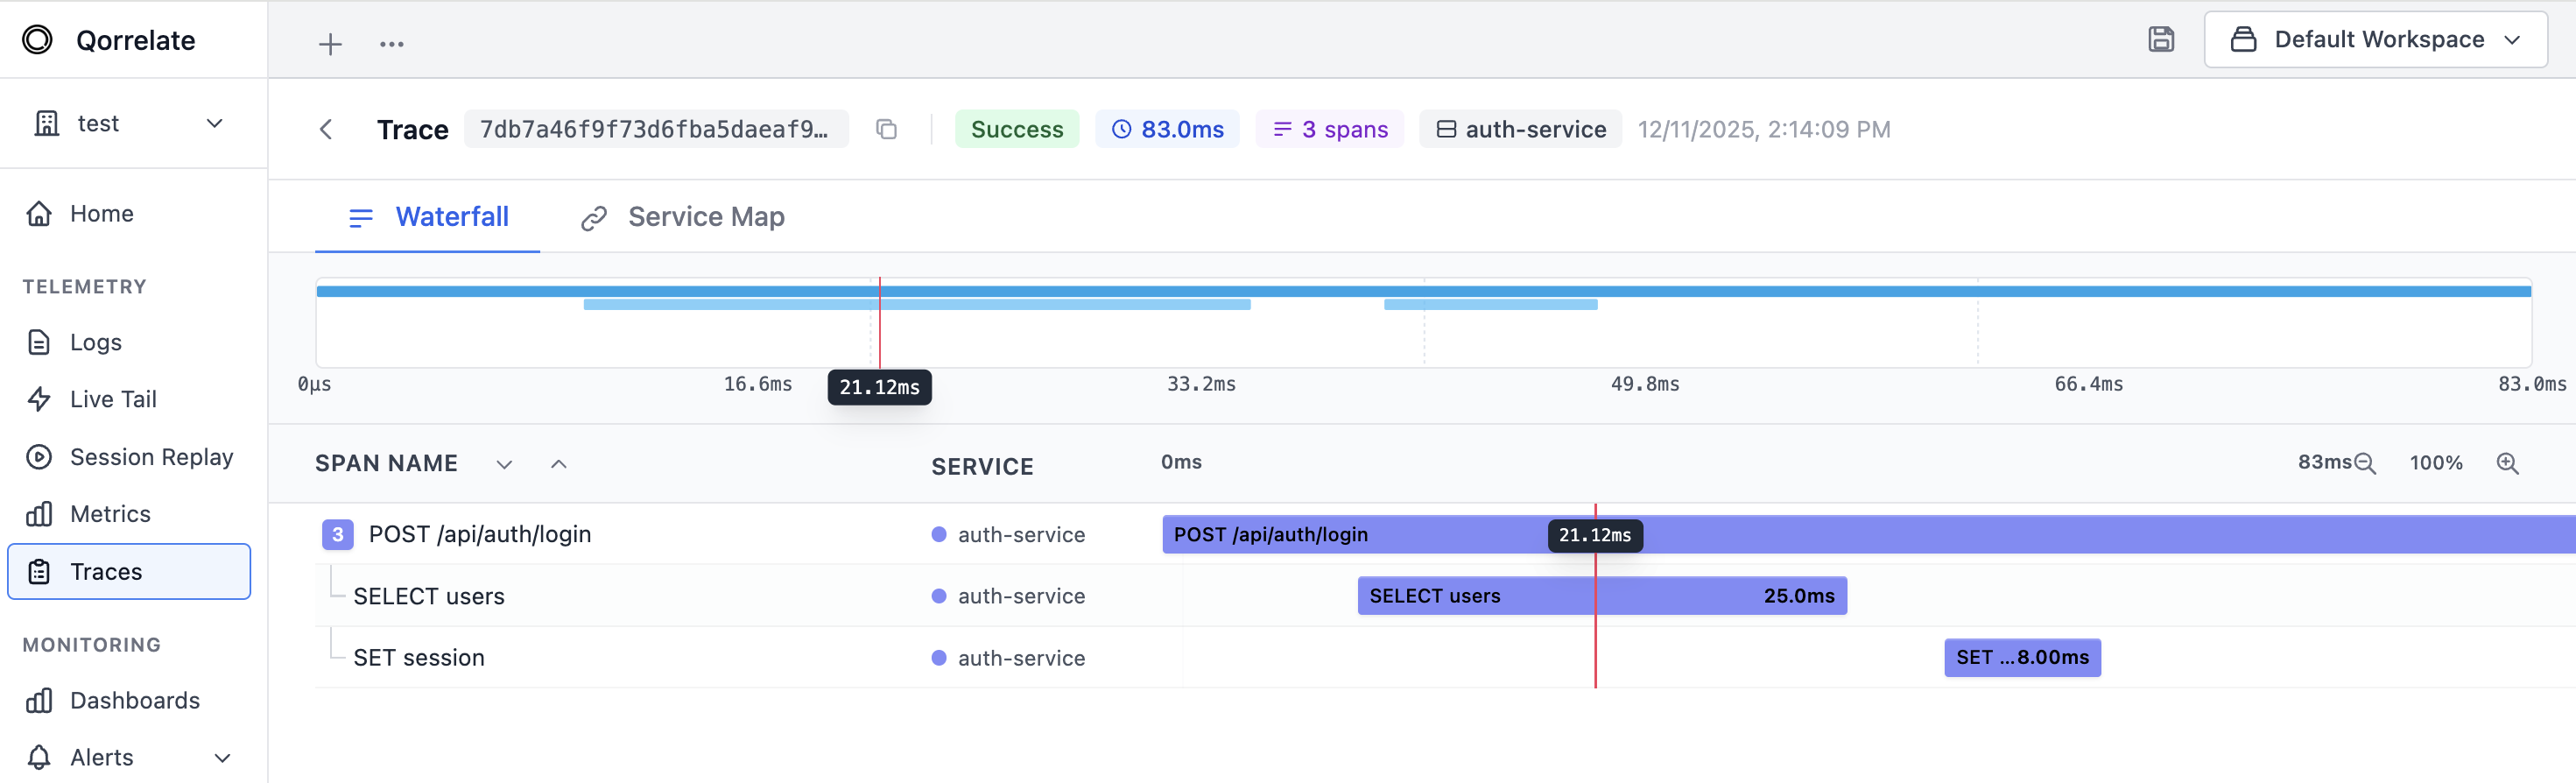
Spot errors and bottlenecks: real-time search and filtering capabilities for all high cardinal attributes. Get heatmap drilldowns, trace details, and context for events, logs, and resources on one page.
Get started in minutes with OpenTelemetry-native monitoring