Observability, Simplified
Qorrelate
Zero ops burden
Elastic
Complex ops overhead
OpenTelemetry-native platform for seamless, standardized data collection and interoperability across cloud and distributed systems.
Your advantage: Native OTel semantic conventions—no ECS mapping layer. Your queries and dashboards work as-is.
Elastic translates OTel attributes into ECS (Elastic Common Schema), renaming fields and requiring schema mapping for queries.
Why it matters: ECS schema translation means OTel queries don't work out-of-the-box. Dashboards and alerts need rewriting for Elastic's field names.
Start in minutes, not weeks. No clusters to manage, no indices to tune, no capacity planning required.
Your advantage: Zero cluster setup. Engineers focus on shipping features, not managing Elasticsearch.
Elasticsearch requires dedicated engineers for cluster management, index lifecycle policies, and ongoing capacity planning.
Why it matters: Shards, indices, and capacity planning drain engineering time. Your team could be building product instead.
Built for OpenTelemetry from day one. Standard semantic conventions and automatic correlation with no custom mapping required.
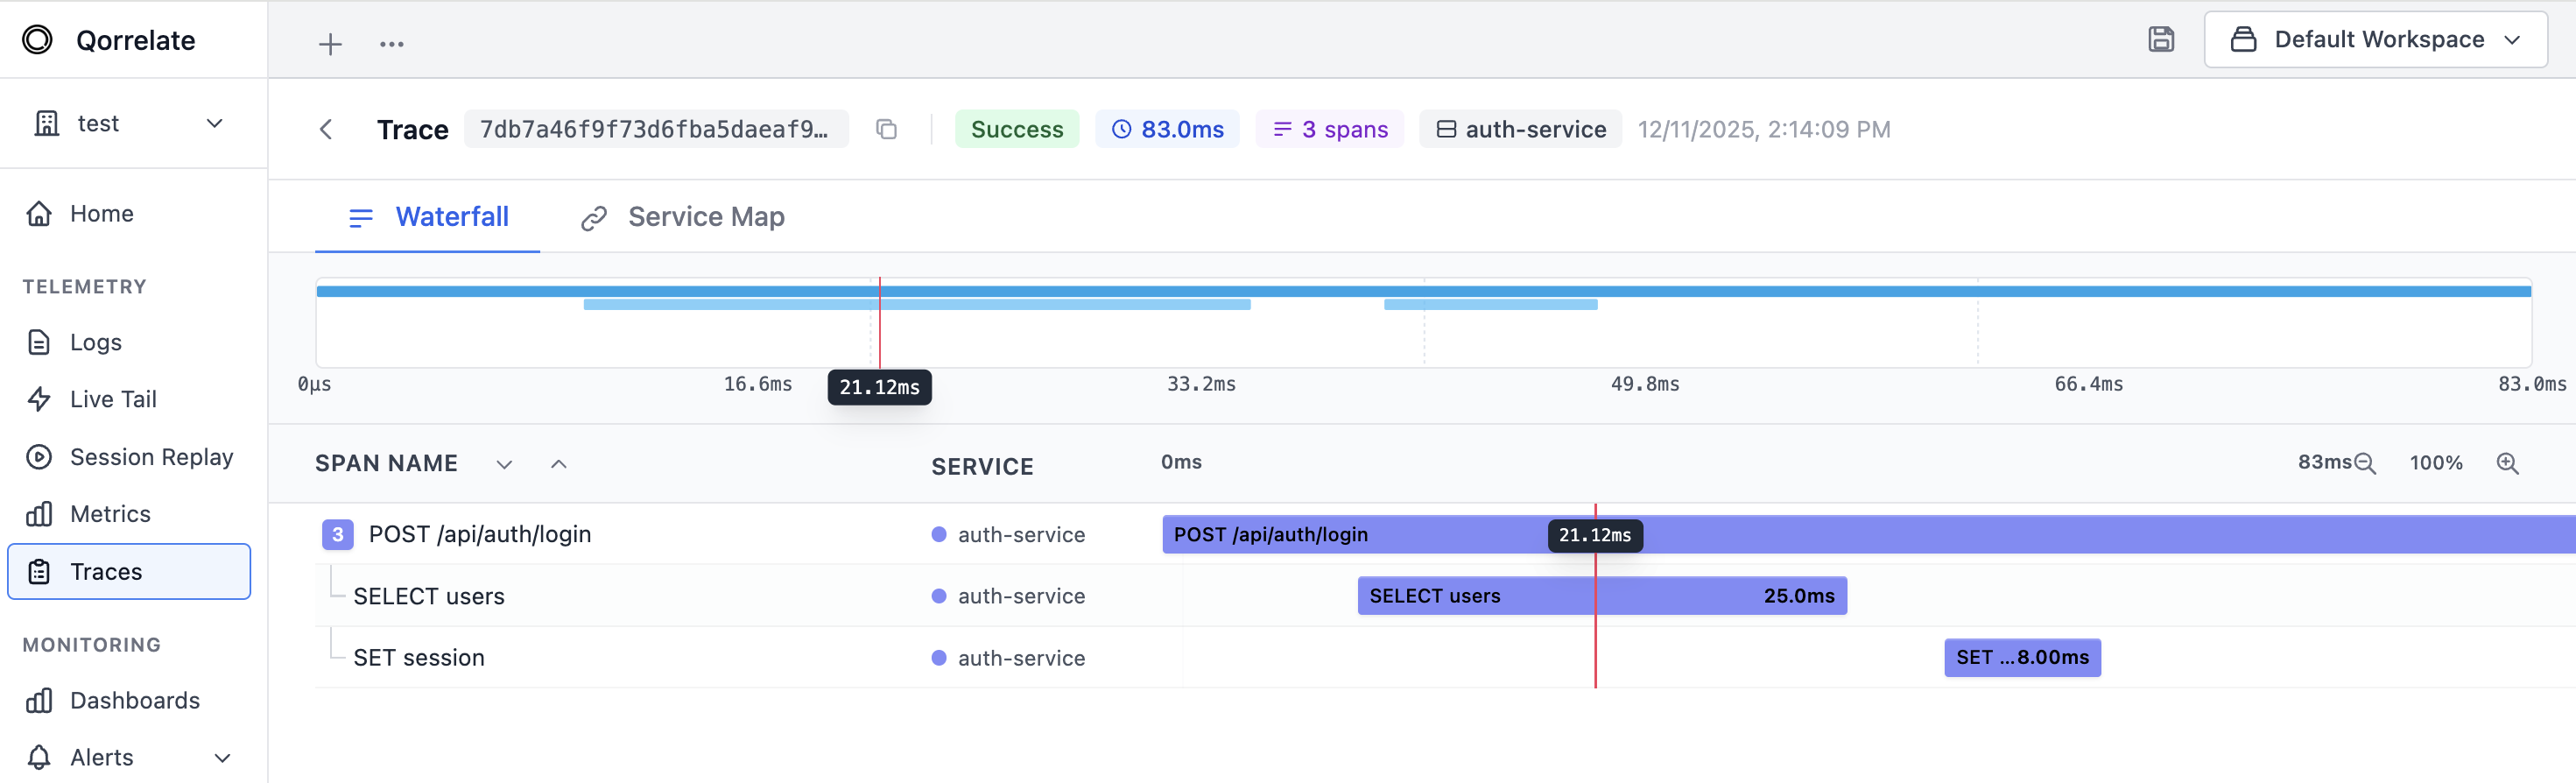
Your advantage: Traces, logs, and metrics link automatically via trace_id. No ECS-to-OTel mapping maintenance.
Elasticsearch requires careful index mapping for observability data. OTel support exists but needs custom configuration to work.
Why it matters: ECS schema differences mean re-writing queries when moving data. Every new OTel release risks breaking mappings.
See what users experienced with built-in session replay, automatically correlated with backend traces and logs.
Your advantage: See what users did when errors occurred. One-click link from replay to trace to logs—no manual correlation.
Elastic doesn't offer session replay. You need separate tooling to understand user experience issues in the frontend.
Why it matters: Frontend debugging requires stitching Elastic + a third-party replay tool. Context-switching slows incident response.
Only pay for the telemetry data you actually use, after filtering out noise with the built-in spam filter.
Your advantage: Drop filters remove junk before ingest. Elastic bills on raw volume—you pay for noise you never query.
You pay for all ingested data upfront, regardless of any filtering applied within Elastic after ingestion.
Why it matters: No pre-ingest filtering. Storage and indexing costs balloon with debug logs and health-check noise.
See how we compare on the features that matter
| Features | ||
|---|---|---|
| Easy to set up and use | ||
| OpenTelemetry-native | ||
| Transparent pricing | ||
| Fully managed (no ops burden) | ||
| Session replay | ||
| AI-powered log analysis | ||
| No vendor lock-in |
No complex setups, no maintenance – all the context for your logs, metrics and traces.
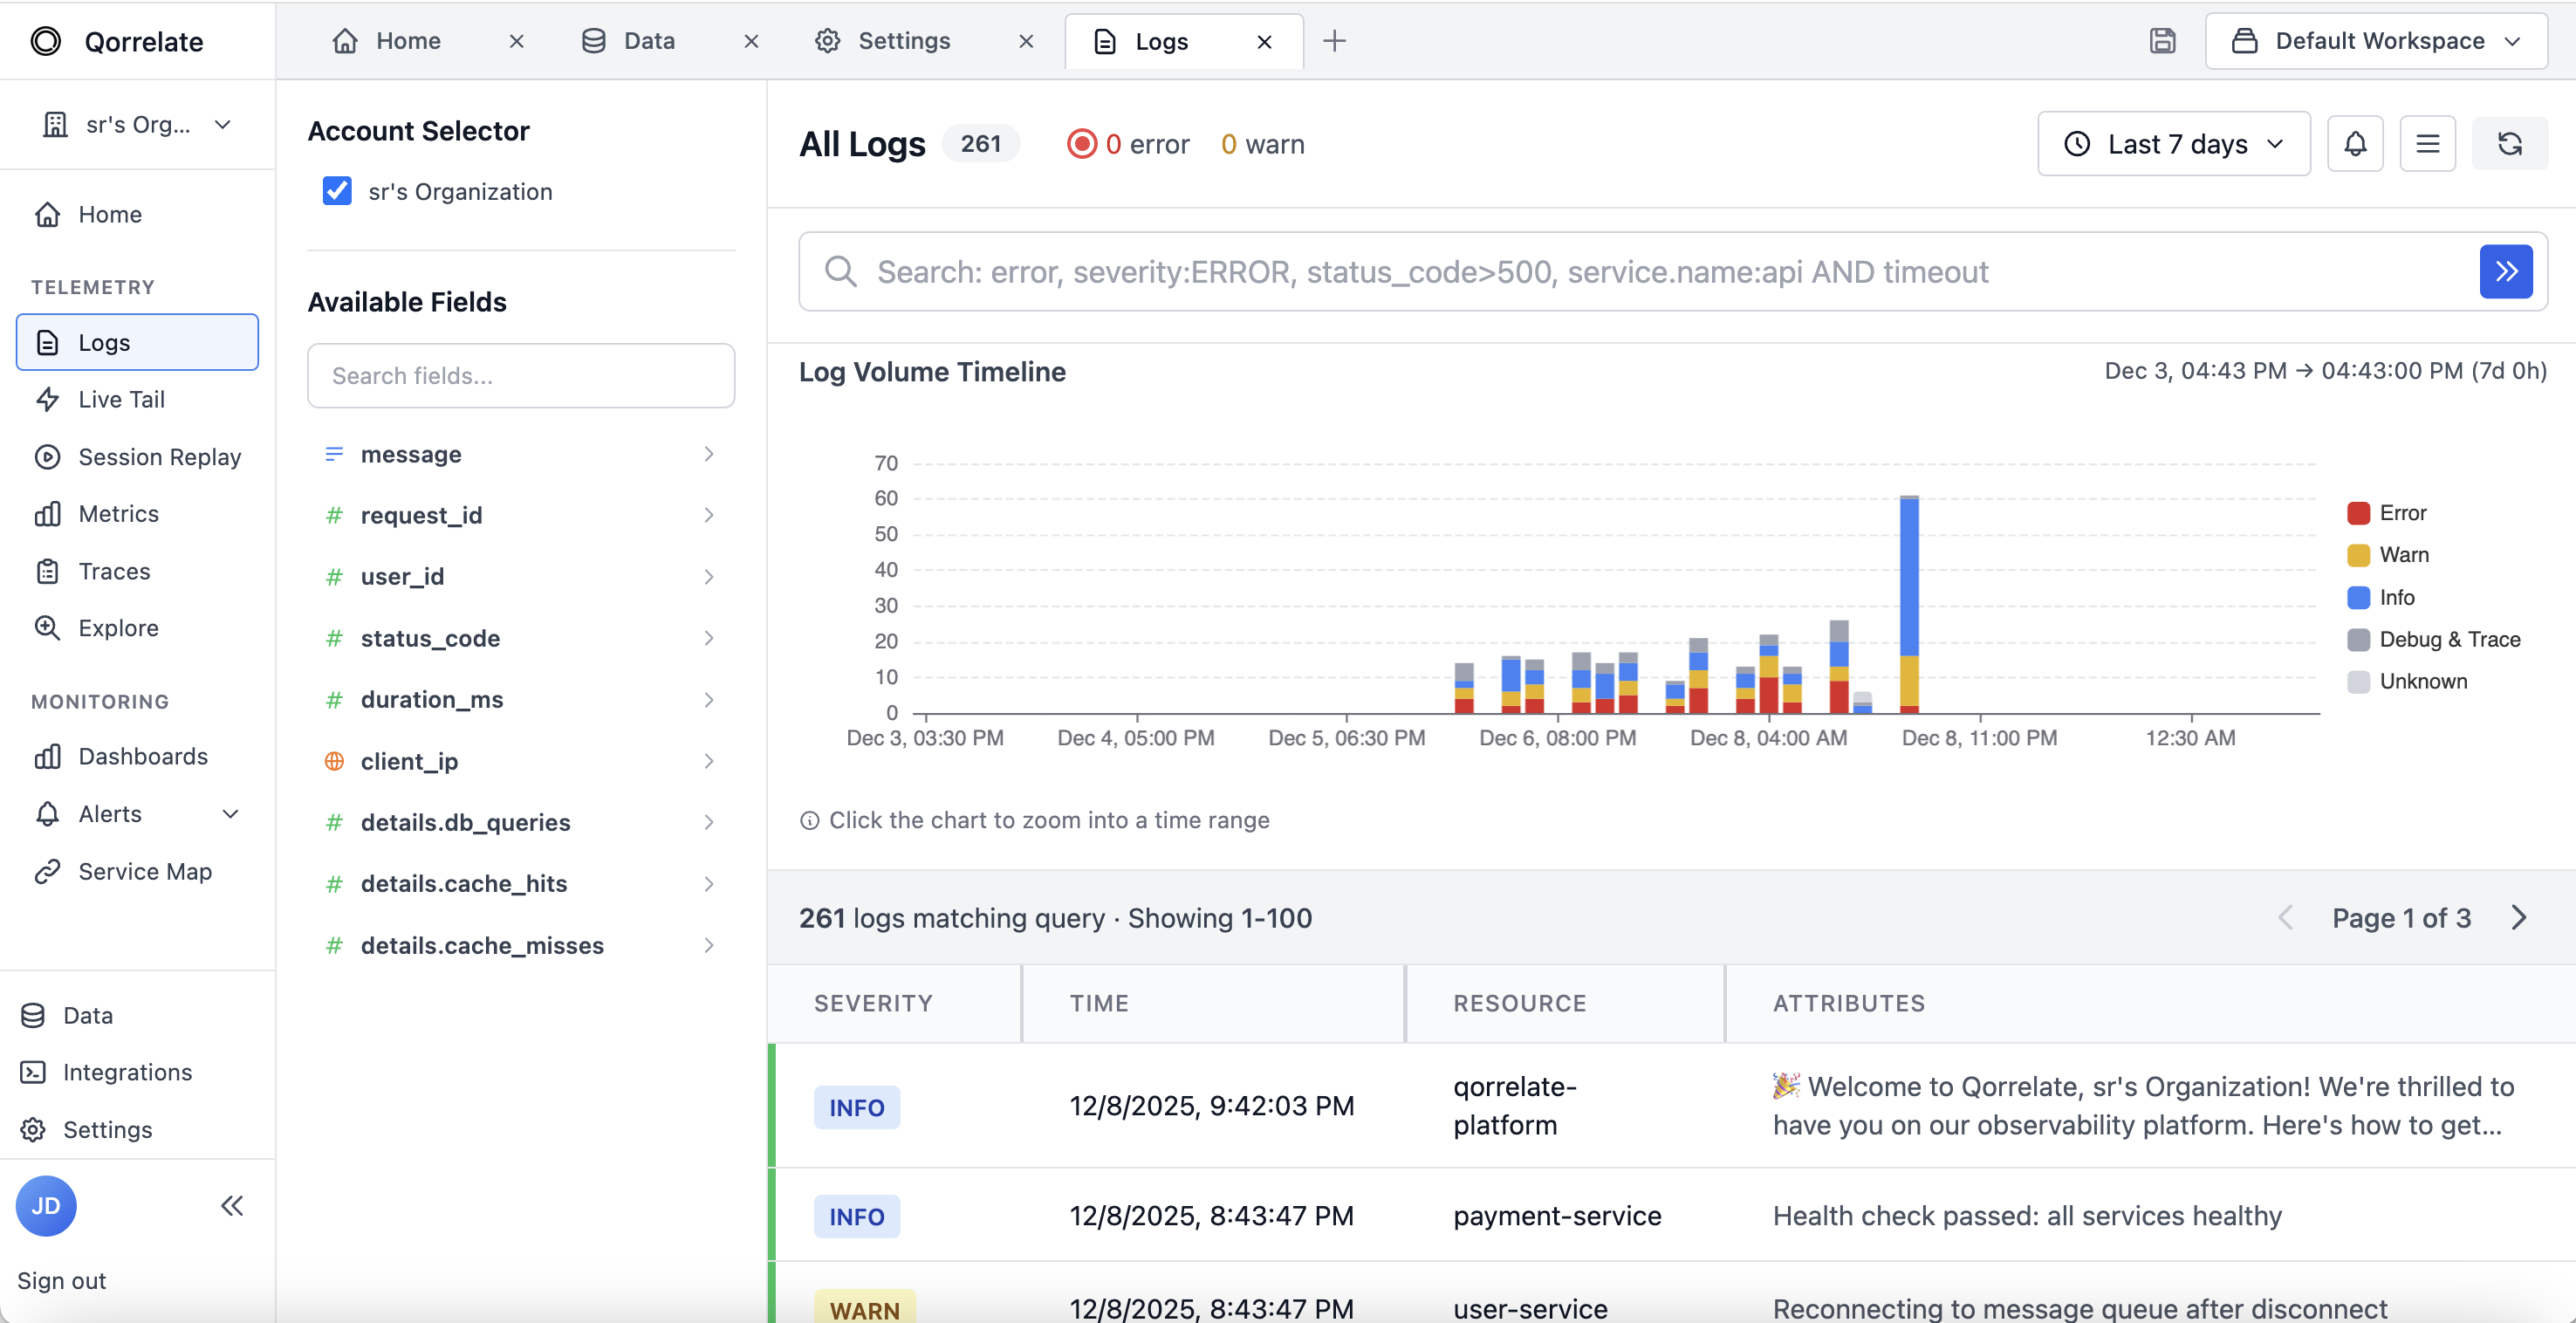
Manage diverse logs with the fastest search and filtering capabilities. Leverage OpenTelemetry semantic conventions for context.
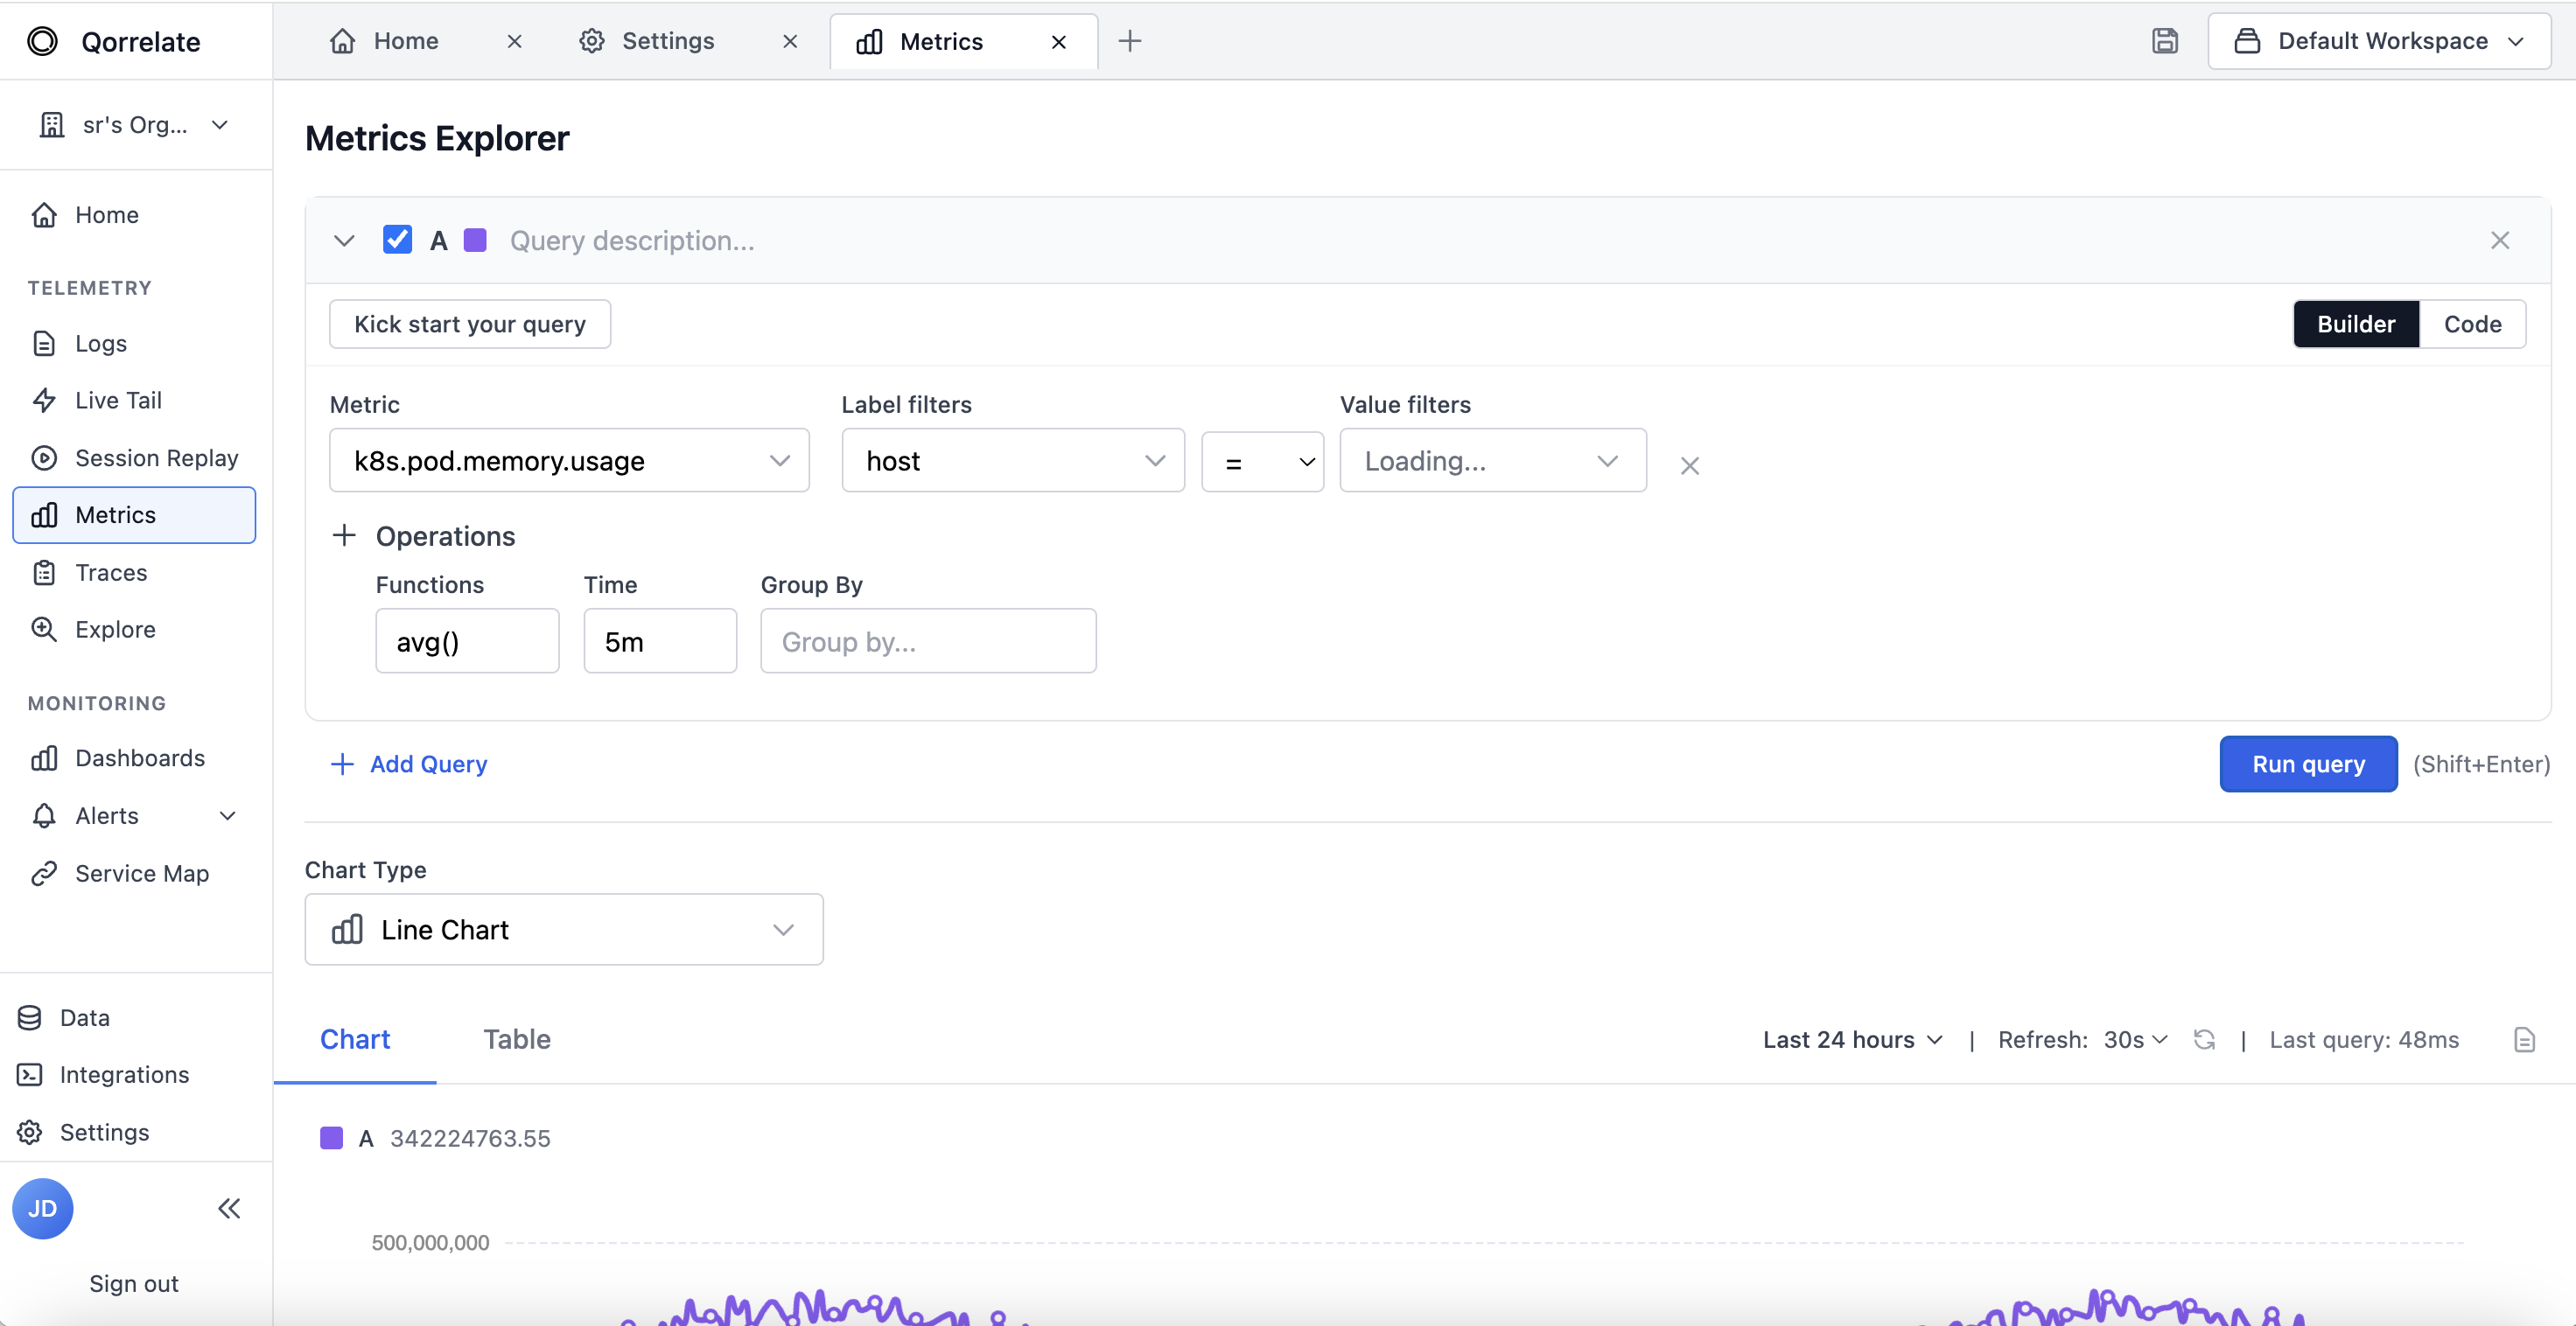
Centralize Prometheus & OpenTelemetry metrics to monitor your infrastructure and service with ease.
Spot errors and bottlenecks: real-time search and filtering capabilities for all high cardinal attributes.
Get started in minutes with OpenTelemetry-native monitoring